Go directly to any of the following sections:
Learn about start dates, transferring credits, availability of financial aid, and more by contacting the universities below.
Ranked at #4 in College Factual's most recent rankings, Columbia is in the top 1% of the country for visual & performing arts students pursuing a bachelor's degree. It is also ranked #1 in New York.
During the 2020-2021 academic year, Columbia University in the City of New York handed out 120 bachelor's degrees in visual & performing arts. This is a decrease of 11% over the previous year when 135 degrees were handed out.
In 2021, 184 students received their master’s degree in visual & performing arts from Columbia. This makes it the #13 most popular school for visual & performing arts master’s degree candidates in the country.
In addition, 26 students received their doctoral degrees in visual & performing arts in 2021, making the school the #20 most popular school in the United States for this category of students.
Take a look at the following statistics related to the make-up of the visual & performing arts majors at Columbia University in the City of New York.
Of the 120 students who earned a bachelor's degree in Visual & Performing Arts from Columbia in 2020-2021, 42% were men and 58% were women.

The following table and chart show the ethnic background for students who recently graduated from Columbia University in the City of New York with a bachelor's in visual & performing arts.

| Ethnic Background | Number of Students |
|---|---|
| Asian | 13 |
| Black or African American | 10 |
| Hispanic or Latino | 16 |
| White | 49 |
| Non-Resident Aliens | 21 |
| Other Races | 11 |
Of the 184 students who earned a master's degree in Visual & Performing Arts from Columbia in 2020-2021, 32% were men and 68% were women.

The following table and chart show the ethnic background for students who recently graduated from Columbia University in the City of New York with a master's in visual & performing arts.
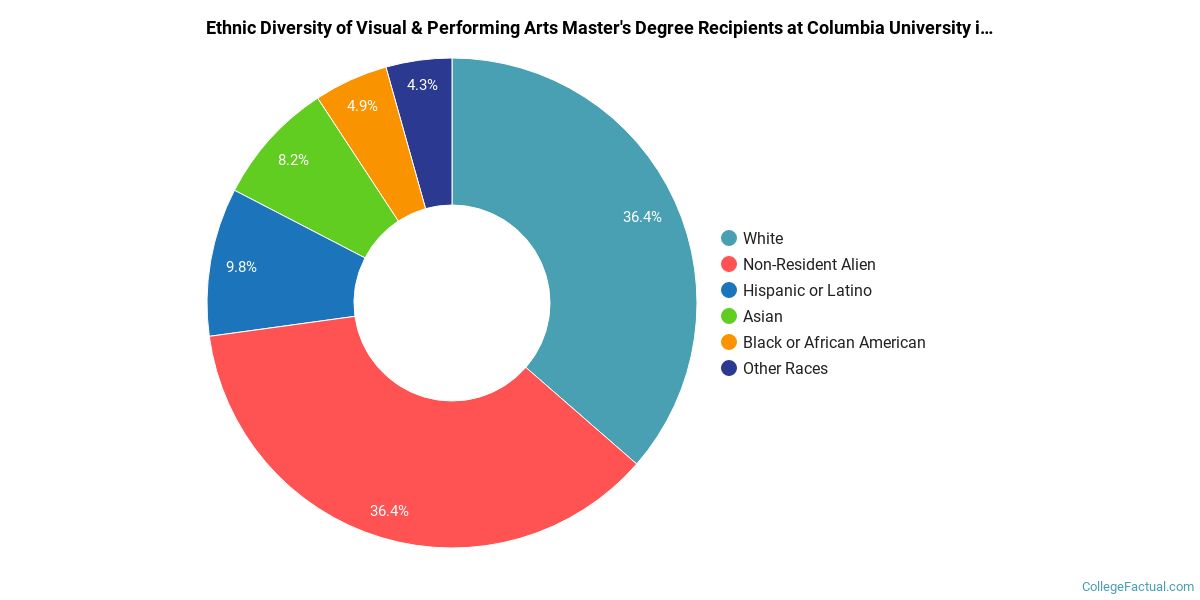
| Ethnic Background | Number of Students |
|---|---|
| Asian | 15 |
| Black or African American | 9 |
| Hispanic or Latino | 18 |
| White | 67 |
| Non-Resident Aliens | 67 |
| Other Races | 8 |
Visual & Performing Arts students may decide to major in one of the following focus areas. Individual majors may not be available for all degree levels.
| Major | Annual Graduates |
|---|---|
| Fine & Studio Arts | 98 |
| Other Visual Art | 90 |
| Film, Video & Photographic Arts | 75 |
| Music | 47 |
| Drama & Theater Arts | 42 |
| General Visual & Performing Arts | 5 |
| Dance | 1 |
More about our data sources and methodologies.