Jump to any of the following sections:
Learn about start dates, transferring credits, availability of financial aid, and more by contacting the universities below.
In College Factual's most recent rankings for the best schools for social sciences majors, Boston College came in at #33. This puts it in the top 5% of the country in this field of study. It is also ranked #3 in Massachusetts.
During the 2020-2021 academic year, Boston College handed out 663 bachelor's degrees in social sciences. This is an increase of 24% over the previous year when 533 degrees were handed out.
In 2021, 77 students received their master’s degree in social sciences from Boston College. This makes it the #45 most popular school for social sciences master’s degree candidates in the country.
In addition, 15 students received their doctoral degrees in social sciences in 2021, making the school the #80 most popular school in the United States for this category of students.
Learn about other programs related to Social Sciences that might interest you.
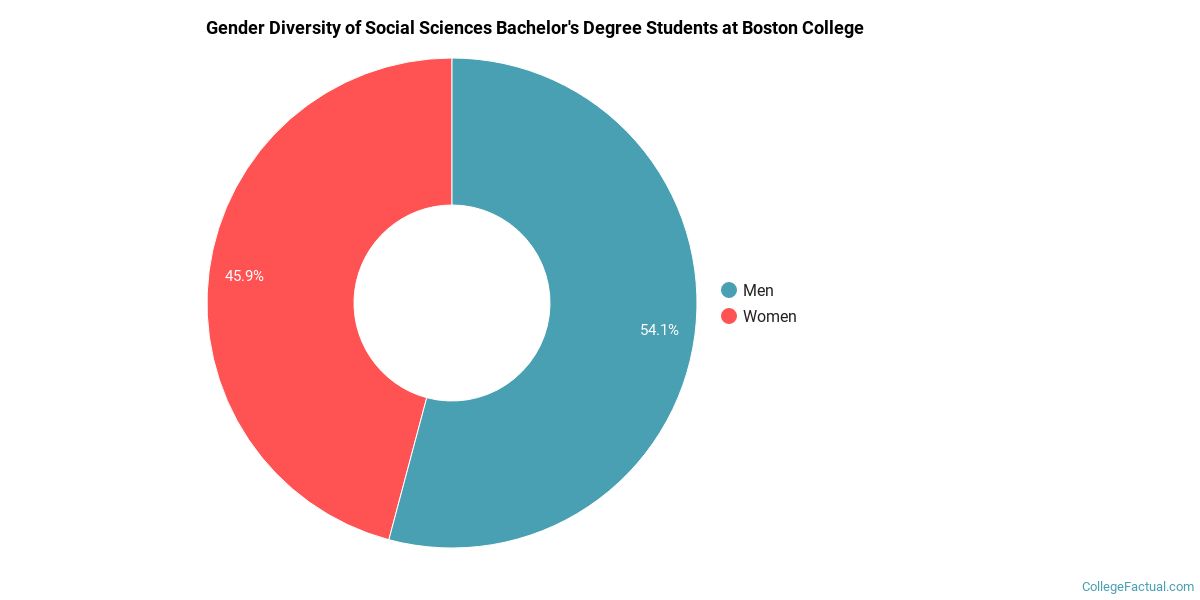
Take a look at the following statistics related to the make-up of the social sciences majors at Boston College.
Of the 663 social sciences students who graduated with a bachelor's degree in 2020-2021 from Boston College, about 54% were men and 46% were women.
The majority of the students with this major are white. About 58% of 2021 graduates were in this category.
The following table and chart show the ethnic background for students who recently graduated from Boston College with a bachelor's in social sciences.

| Ethnic Background | Number of Students |
|---|---|
| Asian | 51 |
| Black or African American | 23 |
| Hispanic or Latino | 85 |
| White | 387 |
| Non-Resident Aliens | 65 |
| Other Races | 52 |
During the 2020-2021 academic year, 77 students graduated with a bachelor's degree in social sciences from Boston College. About 60% were men and 40% were women.

The following table and chart show the ethnic background for students who recently graduated from Boston College with a master's in social sciences.

| Ethnic Background | Number of Students |
|---|---|
| Asian | 3 |
| Black or African American | 2 |
| Hispanic or Latino | 1 |
| White | 16 |
| Non-Resident Aliens | 54 |
| Other Races | 1 |
Social Sciences students may decide to major in one of the following focus areas. Individual majors may not be available for all degree levels.
| Major | Annual Graduates |
|---|---|
| Economics | 445 |
| Political Science & Government | 243 |
| Sociology | 65 |
| General Social Sciences | 2 |
| Related Major | Annual Graduates |
|---|---|
| Communication & Journalism | 168 |
| Theology & Religious Vocations | 116 |
| English Language & Literature | 110 |
| Philosophy & Religious Studies | 100 |
| History | 91 |
More about our data sources and methodologies.
