Jump to any of the following sections:
Learn about start dates, transferring credits, availability of financial aid, and more by contacting the universities below.
Gain a solid understanding of American political history, the current political landscape, and the major political parties with this online bachelor's from Southern New Hampshire University.
UC Davis is in the top 10% of the country for poly sci. More specifically it was ranked #31 out of 588 schools by College Factual. It is also ranked #6 in California.
During the 2020-2021 academic year, University of California - Davis handed out 274 bachelor's degrees in political science. This is an increase of 22% over the previous year when 224 degrees were handed out.
In 2021, 2 students received their master’s degree in poly sci from UC Davis. This makes it the #158 most popular school for poly sci master’s degree candidates in the country.
In addition, 3 students received their doctoral degrees in poly sci in 2021, making the school the #73 most popular school in the United States for this category of students.
Take a look at the following statistics related to the make-up of the poly sci majors at University of California - Davis.
During the 2020-2021 academic year, 274 poly sci majors earned their bachelor's degree from UC Davis. Of these graduates, 44% were men and 56% were women.

The following table and chart show the ethnic background for students who recently graduated from University of California - Davis with a bachelor's in poly sci.
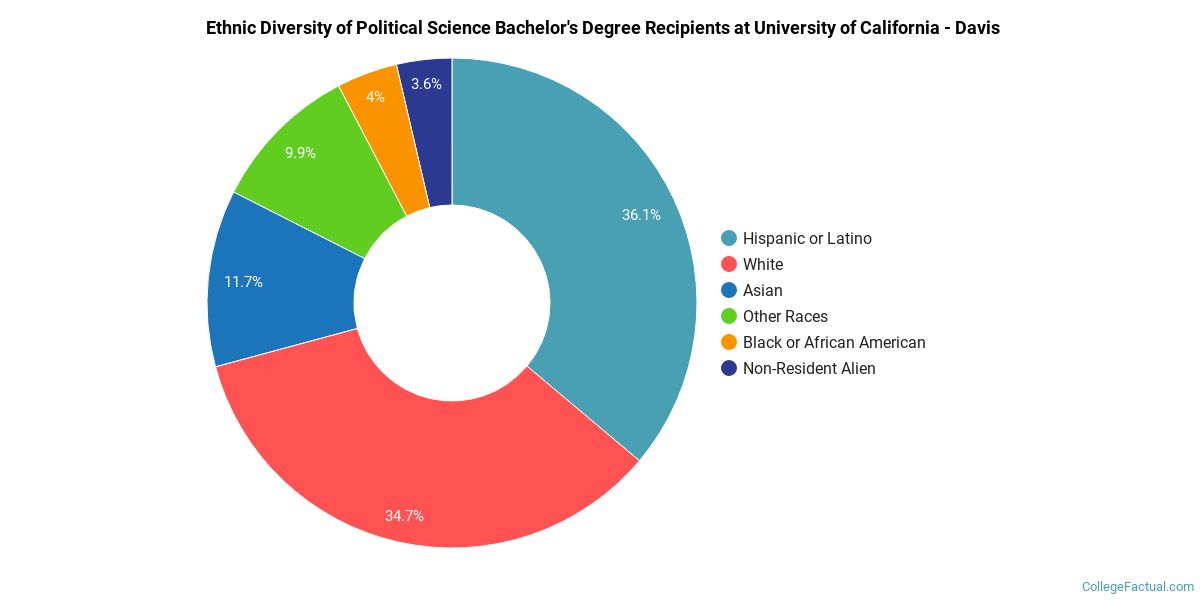
| Ethnic Background | Number of Students |
|---|---|
| Asian | 32 |
| Black or African American | 11 |
| Hispanic or Latino | 99 |
| White | 95 |
| Non-Resident Aliens | 10 |
| Other Races | 27 |
All of the 2 students who graduated with a Master’s in poly sci from UC Davis in 2021 were women.

The following table and chart show the ethnic background for students who recently graduated from University of California - Davis with a master's in poly sci.
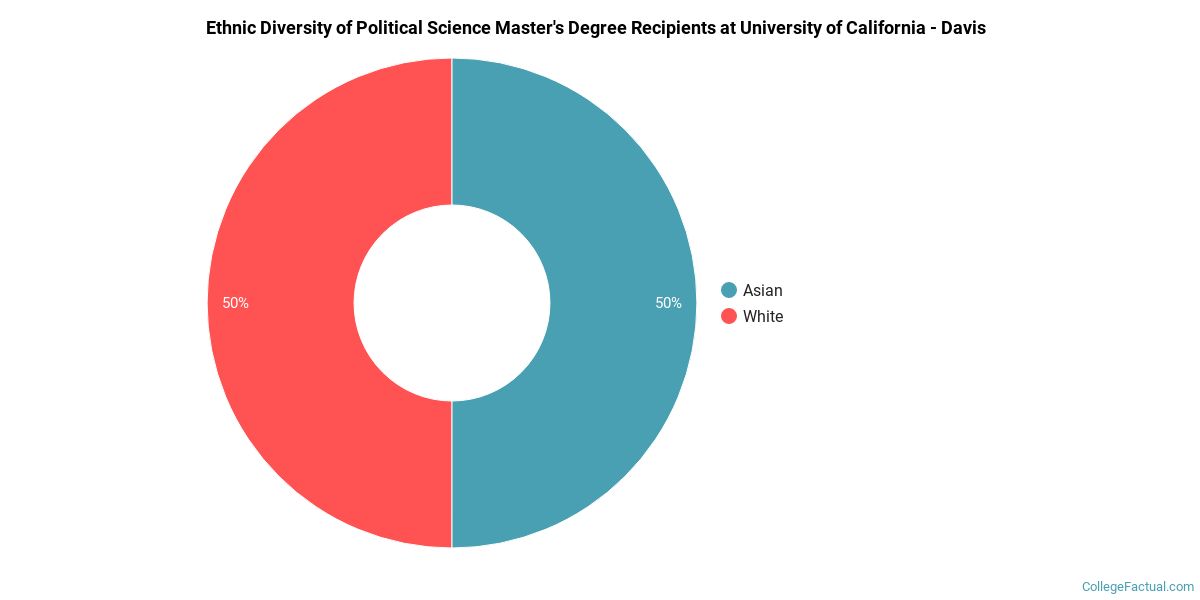
| Ethnic Background | Number of Students |
|---|---|
| Asian | 1 |
| Black or African American | 0 |
| Hispanic or Latino | 0 |
| White | 1 |
| Non-Resident Aliens | 0 |
| Other Races | 0 |
| Related Major | Annual Graduates |
|---|---|
| Other Political Science & Government | 49 |
More about our data sources and methodologies.

