Is The American University really diverse? College Factual’s diversity report brings to light the facts about diversity at The American University. We analyzed racial demographics, gender ratios, student age ranges, and where students come from.
Many schools pride themselves on their diversity, but what does that mean, really? College Factual crunched the numbers to learn how diverse the typical college campus really is, taking into account race, gender, the ages of the students, and where they’re from.
The American University total enrollment is approximately 11,301 students. 7,760 are undergraduates and 3,541 are graduate students.
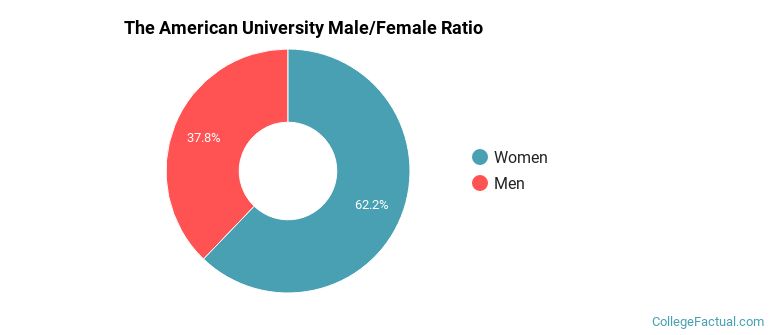
Male/Female Breakdown of Undergraduates
The full-time The American University undergraduate population is made up of 63.2% women, and 36.8% men.
For the gender breakdown for all students, go here.
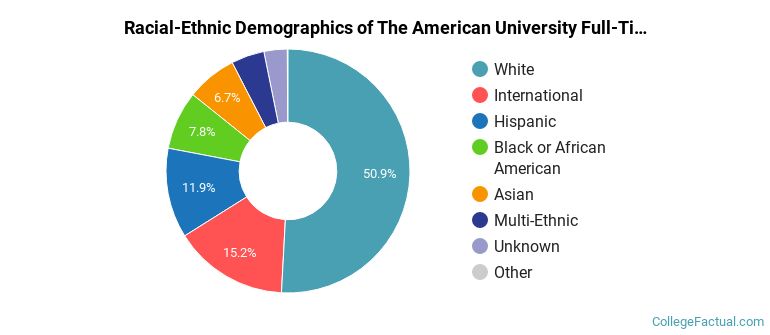
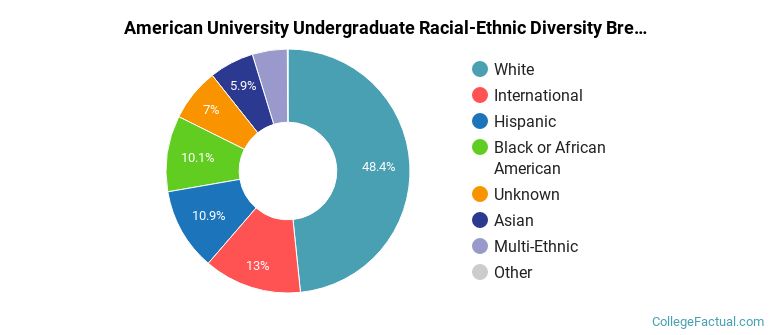
The American University Racial/Ethnic Breakdown of Undergraduates
| Race/Ethnicity | Number | Percent |
|---|---|---|
| White | 4,302 | 55.5% |
| Hispanic | 977 | 12.6% |
| International | 682 | 8.8% |
| Black or African American | 601 | 7.7% |
| Asian | 534 | 6.9% |
| Multi-Ethnic | 431 | 5.6% |
| Unknown | 228 | 2.9% |
| Native Hawaiian or Pacific Islander | 3 | 0.0% |
See racial/ethnic breakdown for all students.
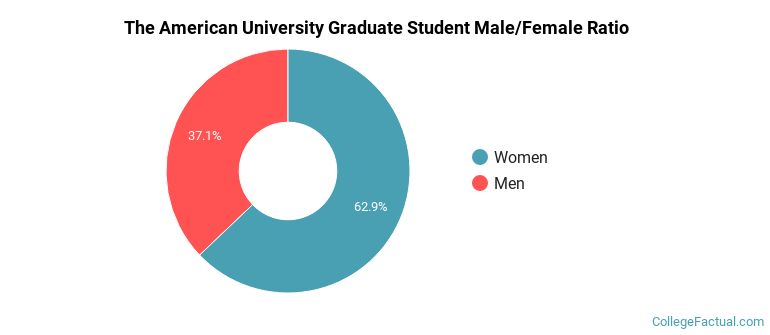
Male/Female Breakdown of Graduate Students
About 63.2% of full-time grad students are women, and 36.8% men.
For the gender breakdown for all students, go here.
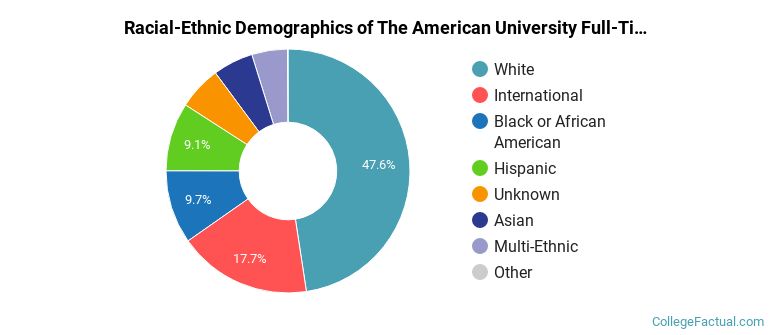
The American University Racial-Ethnic Breakdown of Graduate Students
| Race/Ethnicity | Number | Percent |
|---|---|---|
| White | 1,474 | 41.7% |
| International | 608 | 17.2% |
| Unknown | 429 | 12.1% |
| Hispanic | 412 | 11.6% |
| Black or African American | 297 | 8.4% |
| Asian | 198 | 5.6% |
| Multi-Ethnic | 115 | 3.3% |
| Native Hawaiian or Pacific Islander | 5 | 0.1% |
See racial/ethnic breakdown for all students.
| Race/Ethnicity | Number | Percent |
|---|---|---|
| White | 5,776 | 51.1% |
| Hispanic | 1,389 | 12.3% |
| International | 1,290 | 11.4% |
| Black or African American | 898 | 7.9% |
| Asian | 732 | 6.5% |
| Unknown | 657 | 5.8% |
| Multi-Ethnic | 546 | 4.8% |
| Native Hawaiian or Pacific Islander | 8 | 0.1% |
American University faculty racial/ethnic demographics (share of instructional staff):
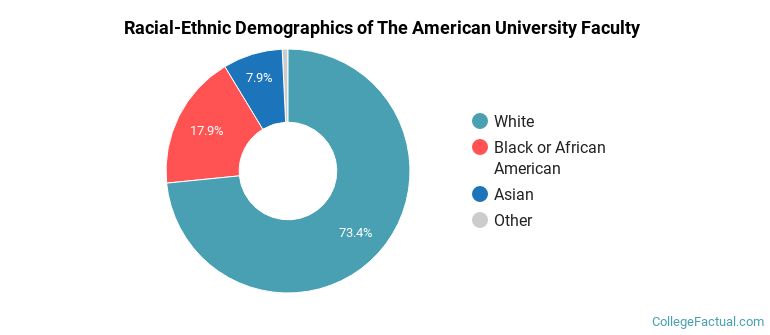
| Ethnicity | Percent of Faculty |
|---|---|
| White | 71.4% |
| Black or African American | 10.7% |
| Asian | 10.0% |
| Hispanic | 4.4% |
| International | 2.8% |
| Unknown | 0.3% |
| Multi-Ethnic | 0.2% |
This school is more popular with women than with men.
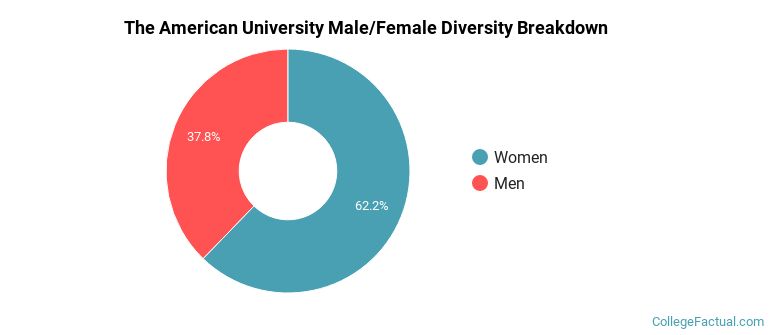
There are approximately 7,142 female students and 4,159 male students at The American University.
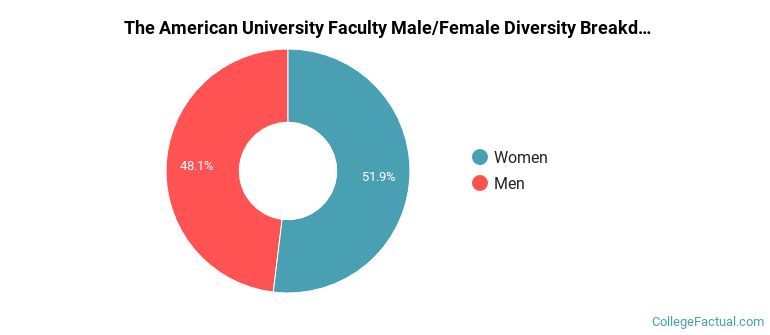
American University faculty gender breakdown (share of instructional staff):
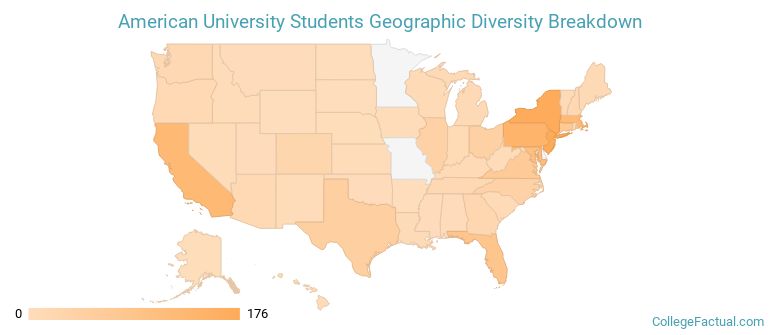
Among first-time degree-seeking undergraduates, 27.8% of The American University students come from within the state, and 72.2% come from out of state.
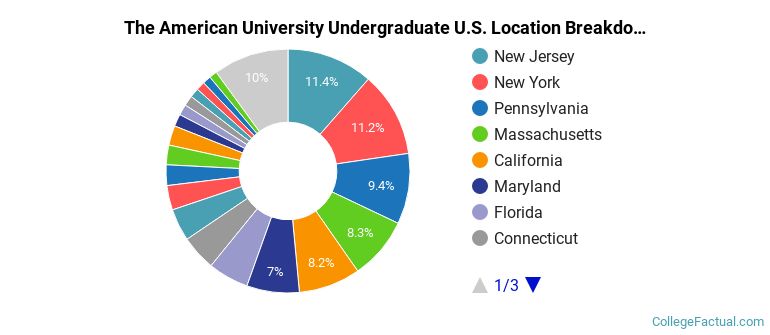
The undergraduate student body is split among 49 states (may include Washington D.C.). Click on the map for more detail.
| State | Amount | Percent |
|---|---|---|
| New York | 168 | 10.6% |
| Maryland | 155 | 9.8% |
| New Jersey | 153 | 9.7% |
| Pennsylvania | 134 | 8.5% |
| Massachusetts | 113 | 7.2% |
The American University hosts approximately 11.4% international (nonresident) students, contributing to the international character of the campus.
Footnotes
*The racial-ethnic minorities count is calculated by taking the total number of students and subtracting white students, international students, and students whose race/ethnicity was unknown. This number is then divided by the total number of students at the school to obtain the racial-ethnic minorities percentage.
References