Here is an overview of this program at Belmont University. Degrees are awarded at the Bachelor’s level. It ranks as high as #1 out of 3 schools (Bachelor’s level) by College Factual. Jump to any of the following sections:
By College Factual’s measure, Belmont University among the top schools in the country for entrepreneurial studies, placing at #42 out of 157 schools nationally.
The table below lists every degree level offered in entrepreneurial studies at Belmont University, along with how many graduates complete each level annually.Degree Level Annual Graduates Bachelor’s 23
In the most recent year for which we have data, Belmont University handed out 23 bachelor’s degrees in entrepreneurial studies.
Belmont University is among the very best schools in the country for entrepreneurial studies at the bachelor’s level. In particular it placed #1 out of 3 schools by College Factual.
Entrepreneurial Studies graduates with a bachelor’s degree from Belmont University earn a median of $57,048 a year. This is higher than $56,239, the median for all majors at Belmont University.

The full-time undergraduate tuition and fees are shown below.In State Out of State Tuition $36,650 $40,560 Fees $1,980 $1,980
Find out more about Belmont University tuition and fees.
For the most recent academic year available, 43% of entrepreneurial studies bachelor’s degrees went to men and 57% went to women.
 The majority of entrepreneurial studies bachelor’s degree graduates at Belmont University were White. Approximately 78% of graduates fell into this category.
The following table and chart show the ethnic background for students who recently graduated from Belmont University with a bachelor’s in entrepreneurial studies.
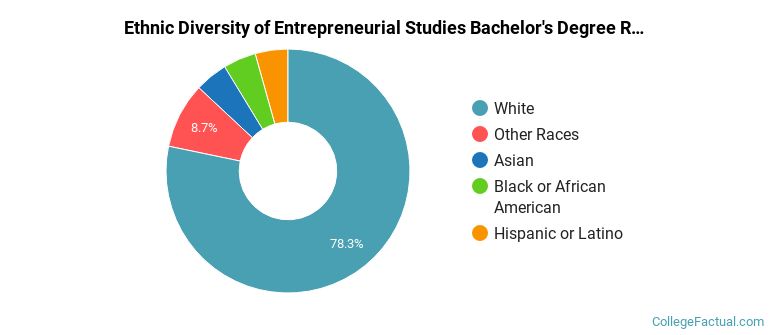
| Ethnic Background | Number of Students |
|---|---|
| Asian | 1 |
| Black or African American | 1 |
| Hispanic or Latino | 1 |
| White | 18 |
| Non-Resident Aliens | 0 |
| Other Races | 2 |
Belmont University granted 18 bachelor’s degrees in entrepreneurship/entrepreneurial studies in the most recent reporting year — 44% to women and 56% to men. The largest share of these graduates were White (83%).
Belmont University awarded 5 bachelor’s degrees in social entrepreneurship in the most recent reporting year — 100% to women and 0% to men. The most common background among these graduates was White (60%).