Here is an overview of this program at Biola University. Degrees are awarded at the Bachelor’s level. It ranks as high as #16 out of 27 schools (Bachelor’s level) by College Factual. Jump to any of the following sections:
By College Factual’s measure, Biola University highly for film, video & photographic arts, coming in at #119 out of 259 schools nationally.Ranking Rank Best Film, Video & Photographic Arts Schools 119 of 259 Best Film, Video & Photographic Arts Schools in California 17 of 40
The table below lists every degree level available for film, video & photographic arts at Biola University, along with how many graduates complete each level annually.Degree Level Annual Graduates Bachelor’s 61
For the most recent IPEDS reporting year, Biola University conferred 61 bachelor’s degrees in film, video & photographic arts.
Biola University ranks competitively among schools offering film, video & photographic arts at the bachelor’s level. Its best result was #16 out of 27 schools by College Factual.
Average full-time tuition and fees are listed in the table below.In State Out of State Tuition $44,382 $48,984
Learn more about Biola University tuition and fees.
Among recent graduates, 67% of film, video & photographic arts bachelor’s degrees went to men and 33% went to women.
 The majority of film, video & photographic arts bachelor’s degree graduates at Biola University were White. About 51% of graduates fell into this category.
The following table and chart show the ethnic background for students who recently graduated from Biola University with a bachelor’s in film, video & photographic arts.
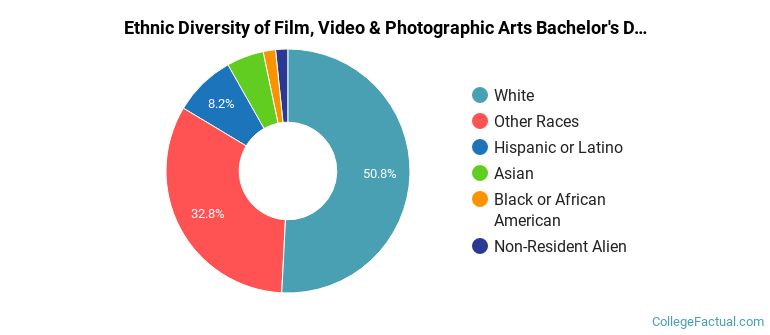
| Ethnic Background | Number of Students |
|---|---|
| Asian | 3 |
| Black or African American | 1 |
| Hispanic or Latino | 5 |
| White | 31 |
| Non-Resident Aliens | 1 |
| Other Races | 20 |
Biola University awarded 61 bachelor’s completions in cinematography and film/video production in the latest year of data — 33% to women and 67% to men. The most common background among these graduates was White (51%).