Here is an overview of this program at BRCC. It is offered at the Associate’s, Certificate levels. Its best result is a rank of #12 out of 17 schools (Associate’s level) by College Factual. Jump to any of the following sections:
College Factual rates BRCC among the top schools in the country for business administration & management, placing at #1,341 out of 2,027 schools nationally.
Here is each degree level offered in business administration & management at BRCC, along with how many graduates complete each level annually.Degree Level Annual Graduates Associate’s 27 Certificate 78
For the most recent IPEDS reporting year, Blue Ridge Community College handed out 27 associate’s degrees in business administration & management.
BRCC ranks competitively among schools offering business administration & management at the associate’s level. Its best result was #12 out of 17 schools by College Factual.
Information about average full-time undergraduate tuition and fees is shown in the table below.In State Out of State Tuition $4,620 $10,560 Fees $744 $1,524
Read more about BRCC tuition and fees.
In the most recent graduating class, 37% of business administration & management associate’s degrees went to men and 63% went to women.
 The largest share of business administration & management associate’s degree graduates at BRCC were White. Roughly 67% of graduates fell into this category.
The following table and chart show the ethnic background for students who recently graduated from Blue Ridge Community College with a associate’s in business administration & management.
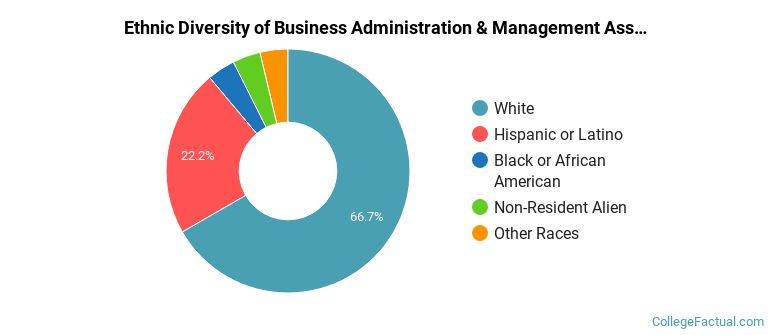
| Ethnic Background | Number of Students |
|---|---|
| Asian | 0 |
| Black or African American | 1 |
| Hispanic or Latino | 6 |
| White | 18 |
| Non-Resident Aliens | 1 |
| Other Races | 1 |
BRCC granted 27 associate’s completions in business administration, management and operations, other recently — 63% to women and 37% to men. The most common background among these graduates was White (67%).
During the most recent reporting year, Blue Ridge Community College awarded 78 certificate degrees in business administration & management.
BRCC is not yet ranked for business administration & management at the certificate level.
Among recent graduates, 27% of business administration & management certificate degrees went to men and 73% went to women.
 The largest share of business administration & management certificate degree graduates at BRCC were White. Approximately 67% of graduates fell into this category.
The following table and chart show the ethnic background for students who recently graduated from Blue Ridge Community College with a certificate in business administration & management.
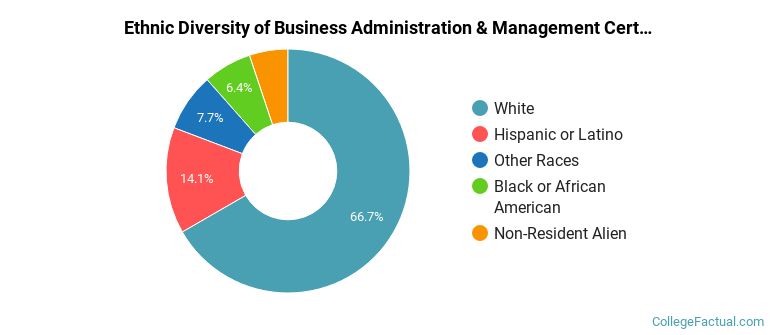
| Ethnic Background | Number of Students |
|---|---|
| Asian | 0 |
| Black or African American | 5 |
| Hispanic or Latino | 11 |
| White | 52 |
| Non-Resident Aliens | 4 |
| Other Races | 6 |
BRCC awarded 78 certificate completions in business administration, management and operations, other in the latest year of data — 73% to women and 27% to men. The most common background among these graduates was White (67%).
More about our data sources and methodologies.