We've gathered data and other essential information about the program, such as the ethnicity of students, how many students graduated in recent times, and more. In addition, we cover how BYU ranks in comparison to other schools with dance programs.
Go directly to any of the following sections:
The bachelor's program at BYU was ranked #55 on College Factual's Best Schools for dance list. It is also ranked #2 in Utah.Ranking Type Rank Best Dance Bachelor’s Degree Schools 53 Best Dance Schools 55
During the 2021-2022 academic year, Brigham Young University - Provo handed out 24 bachelor's degrees in dance. This is a decrease of 8% over the previous year when 26 degrees were handed out.
During the 2022-2023 academic year, part-time undergraduate students at BYU paid an average of $342 per credit hour. No discount was available for in-state students.
Information about average full-time undergraduate tuition and fees is shown in the table below.In State Out of State Tuition $6,496 $6,496 Books and Supplies $1,040 $1,040 On Campus Room and Board $9,720 $9,720 On Campus Other Expenses $5,736 $5,736
Learn more about BYU tuition and fees.
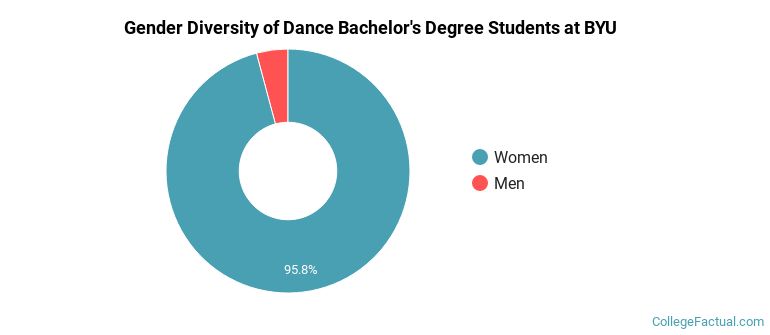
Of the 24 students who earned a bachelor's degree in Dance from BYU in 2021-2022, 4% were men and 96% were women.
The majority of the students with this major are white. About 92% of 2022 graduates were in this category.
The following table and chart show the ethnic background for students who recently graduated from Brigham Young University - Provo with a bachelor's in dance.
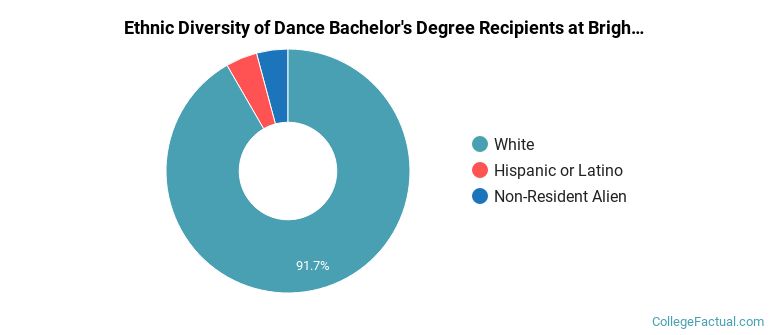
| Ethnic Background | Number of Students |
|---|---|
| Asian | 0 |
| Black or African American | 0 |
| Hispanic or Latino | 1 |
| White | 22 |
| Non-Resident Aliens | 1 |
| Other Races | 0 |
Online degrees for the BYU dance bachelor’s degree program are not available at this time. To see if the school offers distance learning options in other areas, visit the BYU Online Learning page.
Take a look at the following statistics related to the make-up of the dance majors at Brigham Young University - Provo.
| Related Major | Annual Graduates |
|---|---|
| Design & Applied Arts | 72 |
| Music | 66 |
| Fine & Studio Arts | 60 |
| Film, Video & Photographic Arts | 56 |
| Drama & Theater Arts | 41 |
More about our data sources and methodologies.