Below are the key facts about this program at Cal State East Bay. It is offered at the Bachelor’s level, with graduate study also available. Jump to any of the following sections:
The following degree levels are available for mathematics at Cal State East Bay, along with how many graduates complete each level annually.Degree Level Annual Graduates Bachelor’s 22 Master’s 5
During the most recent reporting year, California State University-East Bay handed out 22 bachelor’s degrees in mathematics.
Cal State East Bay is not currently ranked for mathematics at the bachelor’s level.
The full-time undergraduate tuition and fees are shown below.In State Out of State Tuition $5,742 $18,684 Fees $1,499 $1,499
Learn more about Cal State East Bay tuition and fees.
Among recent graduates, 64% of mathematics bachelor’s degrees went to men and 36% went to women.
 The majority of mathematics bachelor’s degree graduates at Cal State East Bay were White. Roughly 41% of graduates fell into this category.
The following table and chart show the ethnic background for students who recently graduated from California State University-East Bay with a bachelor’s in mathematics.
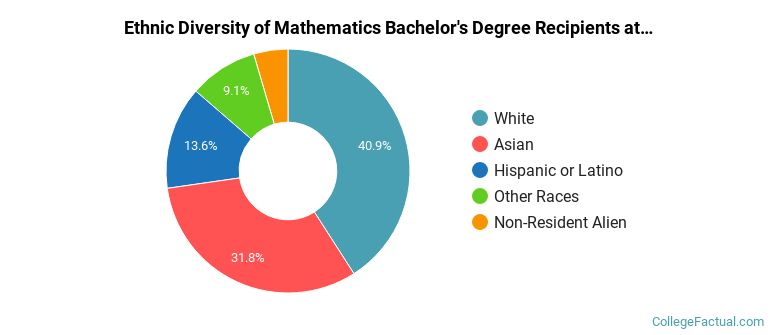
| Ethnic Background | Number of Students |
|---|---|
| Asian | 7 |
| Black or African American | 0 |
| Hispanic or Latino | 3 |
| White | 9 |
| Non-Resident Aliens | 1 |
| Other Races | 2 |
This program is also offered at the graduate level at Cal State East Bay. Annual graduate completions by level are shown below.Graduate Level Annual Graduates Master’s Degrees in Mathematics 5
More about our data sources and methodologies.