Here, you'll find out more about the major, including such details as the number of graduates, what degree levels are offered, ethnicity of students, average salaries, and more. In addition, we cover how CSUSM ranks in comparison to other schools with romance languages programs.
Go directly to any of the following sections:
The bachelor's program at CSUSM was ranked #183 on College Factual's Best Schools for romance languages list. It is also ranked #22 in California.Ranking Type Rank Best Romance Languages Bachelor’s Degree Schools 176 Best Romance Languages Schools 183
During the 2021-2022 academic year, California State University - San Marcos handed out 23 bachelor's degrees in romance languages. This is a decrease of 8% over the previous year when 25 degrees were handed out.
In 2022, 3 students received their master’s degree in romance languages from CSUSM. This makes it the #99 most popular school for romance languages master’s degree candidates in the country.
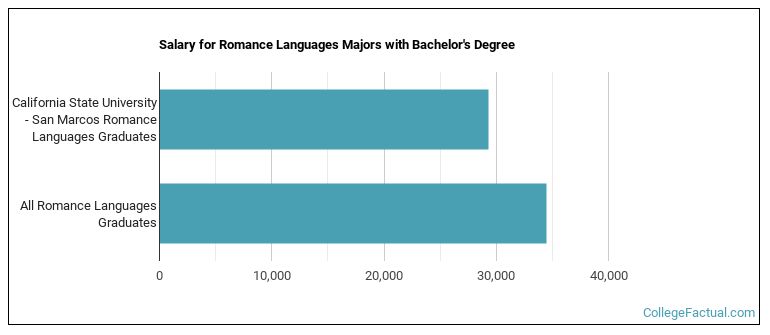
The median salary of romance languages students who receive their bachelor's degree at CSUSM is $29,329. This is less than $34,510, which is the national median of all romance languages majors in the nation who earn bachelor's degrees.
Information about average full-time undergraduate tuition and fees is shown in the table below.In State Out of State Tuition $5,742 $17,622 Fees $1,992 $1,992 Books and Supplies $1,018 $1,018 On Campus Room and Board $14,152 $14,152 On Campus Other Expenses $3,714 $3,714
Learn more about CSUSM tuition and fees.
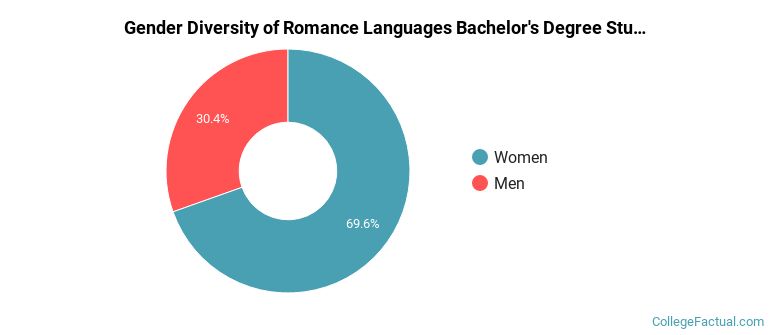
During the 2021-2022 academic year, 23 students graduated with a bachelor's degree in romance languages from CSUSM. About 30% were men and 70% were women.
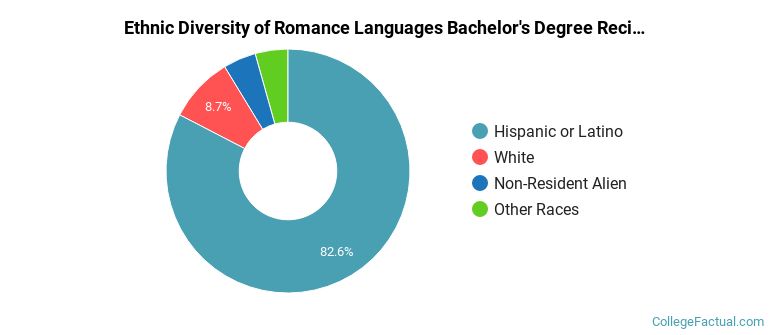
The majority of the bachelor's degree graduates for this major are Hispanic or Latino. In the most recent graduating class for which data is available, 83% of grads fell into this category.
The following table and chart show the ethnic background for students who recently graduated from California State University - San Marcos with a bachelor's in romance languages.
| Ethnic Background | Number of Students |
|---|---|
| Asian | 0 |
| Black or African American | 0 |
| Hispanic or Latino | 19 |
| White | 2 |
| Non-Resident Aliens | 1 |
| Other Races | 1 |
CSUSM does not offer an online option for its romance languages bachelor’s degree program at this time. To see if the school offers distance learning options in other areas, visit the CSUSM Online Learning page.
The romance languages program at CSUSM awarded 3 master's degrees in 2021-2022. About 33% of these degrees went to men with the other 67% going to women.

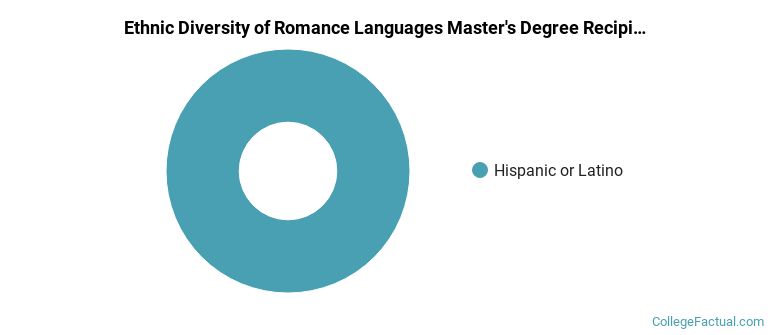
The majority of the master's degree graduates for this major are Hispanic or Latino. In the most recent graduating class for which data is available, 100% of grads fell into this category.
The following table and chart show the ethnic background for students who recently graduated from California State University - San Marcos with a master's in romance languages.
| Ethnic Background | Number of Students |
|---|---|
| Asian | 0 |
| Black or African American | 0 |
| Hispanic or Latino | 3 |
| White | 0 |
| Non-Resident Aliens | 0 |
| Other Races | 0 |
Take a look at the following statistics related to the make-up of the romance languages majors at California State University - San Marcos.
More about our data sources and methodologies.