Here is an overview of this program at Central Piedmont Community College. Degrees are awarded at the Associate’s, Certificate levels. It ranks as high as #2 out of 10 schools (Associate’s level) by College Factual. Jump to any of the following sections:
By College Factual’s measure, Central Piedmont Community College among the top schools in the country for culinary arts, placing at #34 out of 183 schools nationally.Ranking Rank Best Culinary Arts Schools 34 of 183 Best Culinary Arts Schools in North Carolina 2 of 10 Best Culinary Arts Schools in the Southeast Region 3 of 42
Here is each degree level available for culinary arts at Central Piedmont Community College, along with how many graduates complete each level annually.Degree Level Annual Graduates Associate’s 26 Certificate 291
During the most recent reporting year, Central Piedmont Community College awarded 26 associate’s degrees in culinary arts.
Central Piedmont Community College is a solid choice among schools offering culinary arts at the associate’s level. Specifically, it ranked #2 out of 10 schools by College Factual.
The full-time undergraduate tuition and fees are shown below.In State Out of State Tuition $2,432 $8,576 Fees $360 $360
Find out more about Central Piedmont Community College tuition and fees.
For the most recent academic year available, 27% of culinary arts associate’s degrees went to men and 73% went to women.
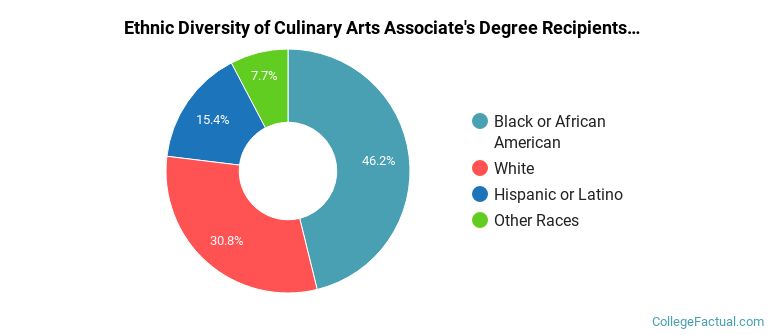
 The largest share of culinary arts associate’s degree graduates at Central Piedmont Community College are Black or African American. About 46% of graduates fell into this category.
The following table and chart show the ethnic background for students who recently graduated from Central Piedmont Community College with a associate’s in culinary arts.
| Ethnic Background | Number of Students |
|---|---|
| Asian | 0 |
| Black or African American | 12 |
| Hispanic or Latino | 4 |
| White | 8 |
| Non-Resident Aliens | 0 |
| Other Races | 2 |
Central Piedmont Community College granted 23 associate’s completions in culinary arts/chef training recently — 70% to women and 30% to men. Most of these graduates identified as Black or African American (48%).
Central Piedmont Community College granted 3 associate’s degrees in baking and pastry arts/baker/pastry chef in the most recent reporting year — 100% to women and 0% to men. The largest share of these graduates were Black or African American (33%).
For the most recent IPEDS reporting year, Central Piedmont Community College conferred 291 certificate degrees in culinary arts.
Central Piedmont Community College is not yet ranked for culinary arts at the certificate level.
Among recent graduates, 44% of culinary arts certificate degrees went to men and 56% went to women.
 The largest share of culinary arts certificate degree graduates at Central Piedmont Community College were White. Approximately 41% of graduates fell into this category.
The following table and chart show the ethnic background for students who recently graduated from Central Piedmont Community College with a certificate in culinary arts.

| Ethnic Background | Number of Students |
|---|---|
| Asian | 2 |
| Black or African American | 85 |
| Hispanic or Latino | 60 |
| White | 120 |
| Non-Resident Aliens | 6 |
| Other Races | 18 |
Central Piedmont Community College conferred 261 certificate degrees in culinary arts/chef training in the most recent reporting year — 51% to women and 49% to men. The most common background among these graduates was White (40%).
Central Piedmont Community College granted 30 certificate completions in baking and pastry arts/baker/pastry chef in the most recent reporting year — 93% to women and 7% to men. The largest share of these graduates were White (53%).
More about our data sources and methodologies.