Below are the key facts about this program at Champlain College. You can study it at the Bachelor’s level. At its best it places at #3 out of 3 schools (Bachelor’s level) by College Factual. Jump to any of the following sections:
College Factual ranks Champlain College among the top schools in the country for film, video & photographic arts, coming in at #215 out of 259 schools nationally.
Here is each degree level offered in film, video & photographic arts at Champlain College, along with how many graduates complete each level annually.Degree Level Annual Graduates Bachelor’s 18
In the most recent year for which we have data, Champlain College conferred 18 bachelor’s degrees in film, video & photographic arts.
Champlain College ranks competitively among schools offering film, video & photographic arts at the bachelor’s level. Specifically, it ranked #3 out of 3 schools by College Factual.
Film, Video & Photographic Arts graduates with a bachelor’s degree from Champlain College go on to jobs where they make a median salary of $25,486 a year. This is below $65,633, the median for all majors at Champlain College.
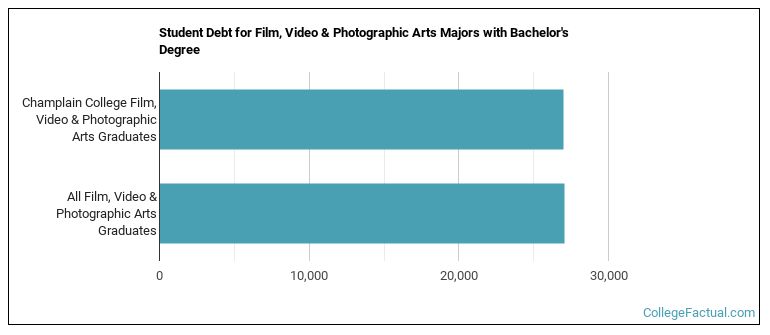
Earning a bachelor’s degree at Champlain College, film, video & photographic arts students borrow a median amount of $27,000 in student loans. This is below $27,038, the typical median for all majors at Champlain College.
Information about average full-time undergraduate tuition and fees is shown in the table below.In State Out of State Tuition $42,564 $47,400 Fees $450 $450
Read more about Champlain College tuition and fees.
In the most recent graduating class, 56% of film, video & photographic arts bachelor’s degrees went to men and 44% went to women.
 The largest share of film, video & photographic arts bachelor’s degree graduates at Champlain College were White. About 78% of graduates fell into this category.
The following table and chart show the ethnic background for students who recently graduated from Champlain College with a bachelor’s in film, video & photographic arts.
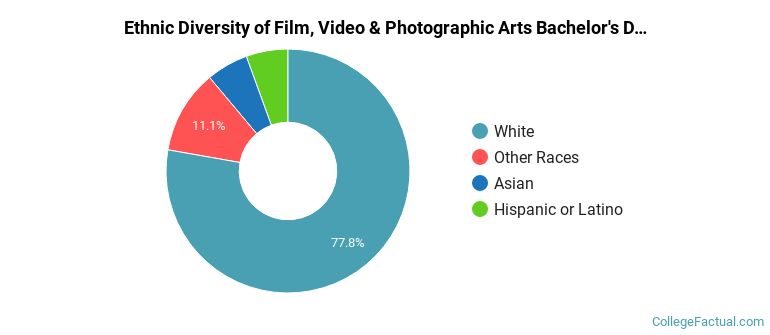
| Ethnic Background | Number of Students |
|---|---|
| Asian | 1 |
| Black or African American | 0 |
| Hispanic or Latino | 1 |
| White | 14 |
| Non-Resident Aliens | 0 |
| Other Races | 2 |
Champlain College conferred 18 bachelor’s degrees in film/cinema/media studies in the most recent reporting year — 44% to women and 56% to men. The most common background among these graduates was White (78%).
