Below are the key facts about this program at Chapman University. Degrees are awarded at the Bachelor’s level, with graduate study also available. Its best result is a rank of #5 out of 73 schools (Bachelor’s level) by College Factual. Jump to any of the following sections:
College Factual ranks Chapman University among the top schools in the country for visual & performing arts, coming in at #18 out of 1,146 schools nationally.Ranking Rank Best Visual & Performing Arts Schools 18 of 1,146 Best Visual & Performing Arts Schools in California 5 of 164
Here is each degree level offered in visual & performing arts at Chapman University, along with how many graduates complete each level annually.Degree Level Annual Graduates Bachelor’s 398 Master’s 115
This visual & performing arts area of study at Chapman University covers the following majors. Choose a major for its full rankings, popularity, and outcomes:Major Annual Graduates Film/Video and Photographic Arts 295 Drama/Theatre Arts and Stagecraft 107 Dance 35 Design and Applied Arts 35 Music 30 Fine and Studio Arts 11
During the most recent reporting year, Chapman University awarded 398 bachelor’s degrees in visual & performing arts.
Chapman University is in the top 5% of the country for visual & performing arts at the bachelor’s level. Its best result was #5 out of 73 schools by College Factual.
Visual & Performing Arts students who finish a bachelor’s at Chapman University report a median salary of $49,573 a year. This is lower than $68,393, the median for all majors at Chapman University.
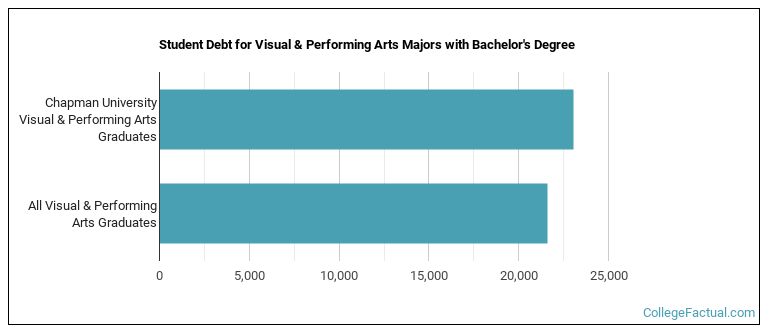
To complete a bachelor’s at Chapman University, visual & performing arts graduates take on a median debt of $23,049 in student loans. This is above $21,581, the typical median for all majors at Chapman University.
Average full-time tuition and fees are listed in the table below.In State Out of State Tuition $58,250 $64,580 Fees $404 $404
Read more about Chapman University tuition and fees.
Among recent graduates, 38% of visual & performing arts bachelor’s degrees went to men and 62% went to women.
 The largest share of visual & performing arts bachelor’s degree graduates at Chapman University are White. Approximately 58% of graduates fell into this category.
The following table and chart show the ethnic background for students who recently graduated from Chapman University with a bachelor’s in visual & performing arts.

| Ethnic Background | Number of Students |
|---|---|
| Asian | 35 |
| Black or African American | 12 |
| Hispanic or Latino | 60 |
| White | 229 |
| Non-Resident Aliens | 21 |
| Other Races | 41 |
Graduate study is also available at Chapman University. The following graduate award levels are reported.Graduate Level Annual Graduates Master’s Degrees in Visual & Performing Arts 115
