Here is an overview of this program at CVTC. It is offered at the Associate’s, Certificate levels. It ranks as high as #3 out of 17 schools (Associate’s level) by College Factual. Jump to any of the following sections:
College Factual ranks CVTC highly for business administration & management, placing at #372 out of 2,027 schools nationally.
The table below lists every degree level available for business administration & management at CVTC, along with how many graduates complete each level annually.Degree Level Annual Graduates Associate’s 136 Certificate 226
During the most recent reporting year, Chippewa Valley Technical College handed out 136 associate’s degrees in business administration & management.
CVTC holds a strong position among schools offering business administration & management at the associate’s level. Its best result was #3 out of 17 schools by College Factual.
Information about average full-time undergraduate tuition and fees is shown in the table below.In State Out of State Tuition $4,230 $6,728 Fees $359 $359
Find out more about CVTC tuition and fees.
For the most recent academic year available, 41% of business administration & management associate’s degrees went to men and 59% went to women.
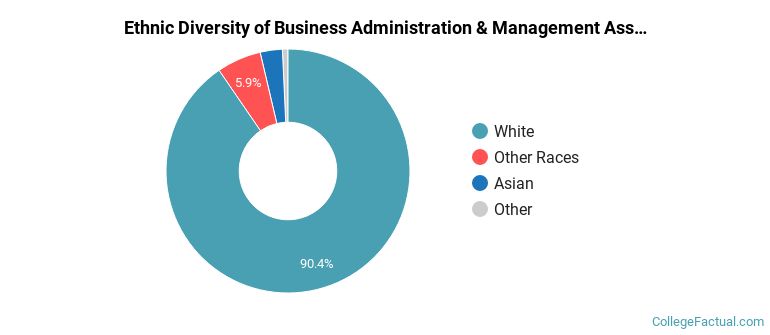
 The majority of business administration & management associate’s degree graduates at CVTC are White. About 90% of graduates fell into this category.
The following table and chart show the ethnic background for students who recently graduated from Chippewa Valley Technical College with a associate’s in business administration & management.
| Ethnic Background | Number of Students |
|---|---|
| Asian | 4 |
| Black or African American | 1 |
| Hispanic or Latino | 0 |
| White | 123 |
| Non-Resident Aliens | 0 |
| Other Races | 8 |
CVTC granted 126 associate’s completions in business administration and management, general recently — 60% to women and 40% to men. Most of these graduates identified as White (90%).
CVTC granted 10 associate’s completions in logistics, materials, and supply chain management in the latest year of data — 40% to women and 60% to men. The largest share of these graduates were White (100%).
For the most recent IPEDS reporting year, Chippewa Valley Technical College awarded 226 certificate degrees in business administration & management.
CVTC is not yet ranked for business administration & management at the certificate level.
In the most recent graduating class, 38% of business administration & management certificate degrees went to men and 62% went to women.
 The largest share of business administration & management certificate degree graduates at CVTC are White. Roughly 93% of graduates fell into this category.
The following table and chart show the ethnic background for students who recently graduated from Chippewa Valley Technical College with a certificate in business administration & management.

| Ethnic Background | Number of Students |
|---|---|
| Asian | 5 |
| Black or African American | 1 |
| Hispanic or Latino | 1 |
| White | 210 |
| Non-Resident Aliens | 0 |
| Other Races | 9 |
CVTC conferred 226 certificate degrees in business administration and management, general in the latest year of data — 62% to women and 38% to men. The most common background among these graduates was White (93%).
More about our data sources and methodologies.