We’ve pulled together the essential facts you should know about the program at Lehman. You can study it at the Bachelor’s level, with graduate study also available. Jump to any of the following sections:
Here is each degree level offered in teacher education subject specific at Lehman, along with how many graduates complete each level annually.Degree Level Annual Graduates Bachelor’s 8 Master’s 105 Graduate Certificate 3 Professional Certificate 14
For the most recent IPEDS reporting year, CUNY Lehman College awarded 8 bachelor’s degrees in teacher education subject specific.
Lehman is not currently ranked for teacher education subject specific at the bachelor’s level.
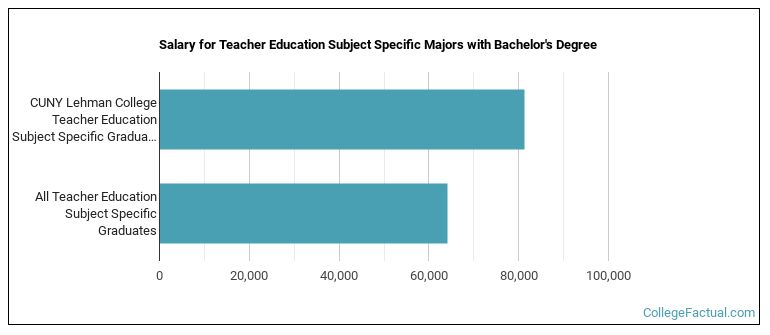
Teacher Education Subject Specific graduates with a bachelor’s degree from Lehman earn a median of $81,242 a year. This is above $64,053, the median for all majors at Lehman.
Information about average full-time undergraduate tuition and fees is shown in the table below.In State Out of State Tuition $6,930 $14,880 Fees $480 $480
Learn more about Lehman tuition and fees.
Among recent graduates, 38% of teacher education subject specific bachelor’s degrees went to men and 62% went to women.
 The majority of teacher education subject specific bachelor’s degree graduates at Lehman were Hispanic or Latino. Roughly 62% of graduates fell into this category.
The following table and chart show the ethnic background for students who recently graduated from CUNY Lehman College with a bachelor’s in teacher education subject specific.

| Ethnic Background | Number of Students |
|---|---|
| Asian | 0 |
| Black or African American | 0 |
| Hispanic or Latino | 5 |
| White | 1 |
| Non-Resident Aliens | 0 |
| Other Races | 2 |
Lehman granted 4 bachelor’s completions in history teacher education in the most recent reporting year — 50% to women and 50% to men. The most common background among these graduates was Hispanic or Latino (50%).
Lehman conferred 2 bachelor’s completions in biology teacher education recently — 50% to women and 50% to men. Most of these graduates identified as Hispanic or Latino (50%).
Lehman awarded 2 bachelor’s completions in spanish language teacher education in the latest year of data — 100% to women and 0% to men. The most common background among these graduates was Hispanic or Latino (100%).
Graduate study is also available at Lehman. Annual graduate completions by level are shown below.