Make an informed decision about your education by understanding QC retention and graduation rates. First year retention rates let you know how many first-time, full-time students students come back for their second year. Graduation rates tell you how many students complete their degree and how long it takes.
The freshmen retention rate applies to first-time / full-time students who come back for their second year.
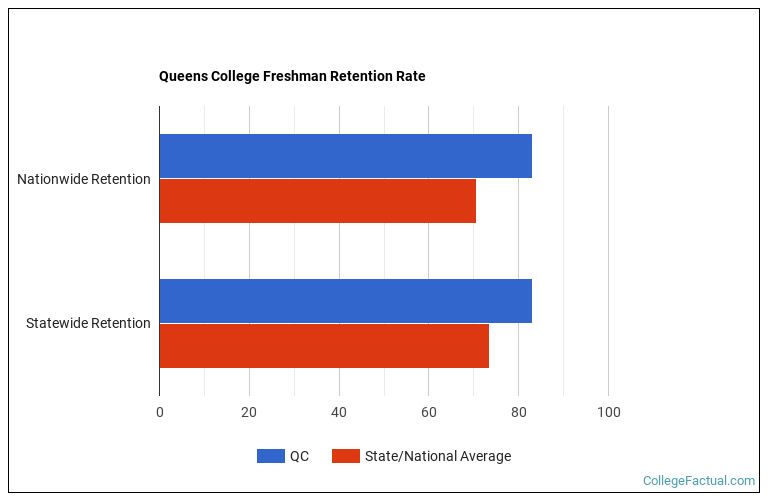
With 79% students making it past their freshmen year, QC has freshmen retention rates above the national average.
Nationwide, the average first to second year retention rate is 70.57%.
When looking at just colleges and universities in New York, the average is 73.51%.
| Retention Rate | |
|---|---|
| QC | 79% |
| Nationwide | 70.57% |
| New York | 73.51% |
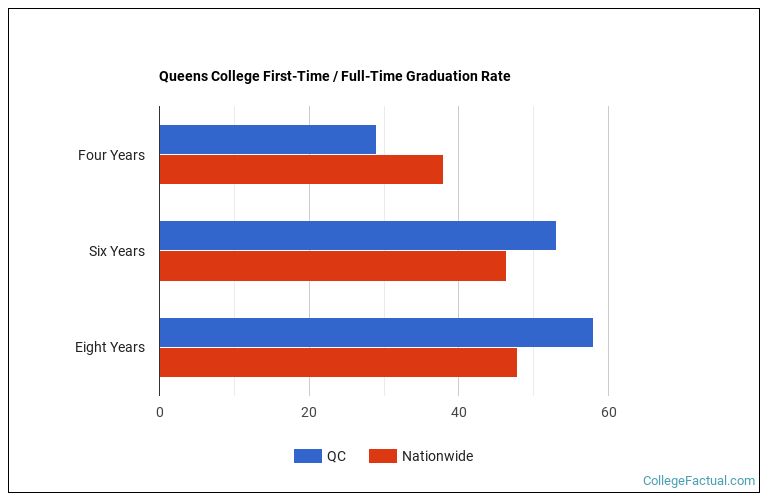
How many of the estimated 2984 students in the class of 2023 actually finished their degree in a timely fashion?
Four years after beginning their degree, 39% of those students had graduated. By 2025, six years after starting their degree, 53% of the students had graduated and after eight years 56% of this class completed their degree.
Any student who completes their bachelor's degree within six years is considered to have graduated on time, according to the National Center for Education Statistics. This makes the offical QC graduation rate 53%.


| Completion Within | Undergraduates | Percentage |
|---|---|---|
| Four Years | 2158 | 39% |
| Six Years | 2984 | 53% |
| Eight Years | 146 | 3% |
| Did Not Complete | 2453 | 44% |
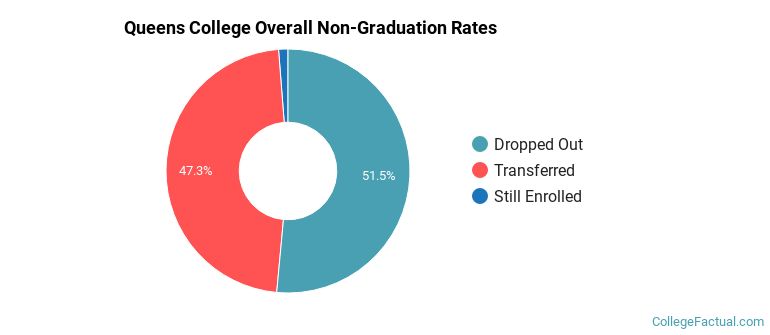
The non-completers rate is anyone who is not still enrolled at the institution after eight years. Both transfer students and drop-outs could be included in this group.
Approximately 2453 students or 44% of the cohort did not complete their degree within eight years.
What happened to the 2453 students who did not complete their degree?
23 are still enrolled.
1170 transferred to another institution.
QC lost contact with the remaining 1204 who we assumed dropped out.
| Non-Completions | Undergraduates | Percentage |
|---|---|---|
| Still Enrolled | 23 | 0.9% |
| Transferred | 1170 | 47.7% |
| Dropped Out | 1204 | 49.1% |
| Race/Ethnicity | Graduation Rate |
|---|---|
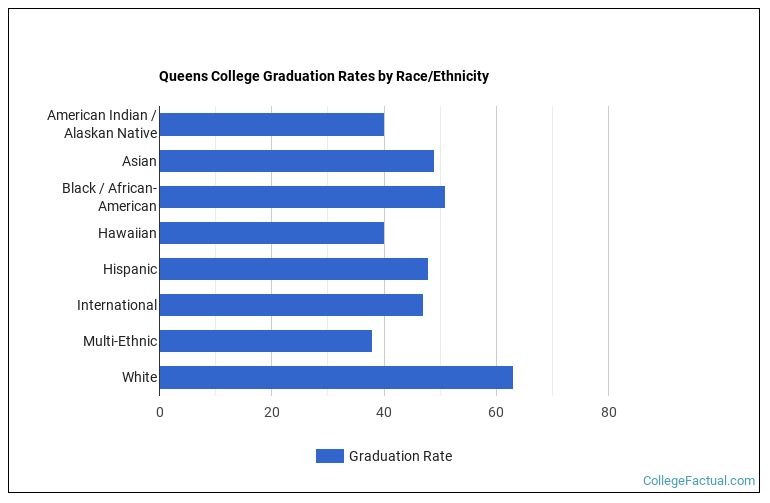
| American Indian or Alaskan Native | 78% |
| Asian | 58% |
| Black / African-American | 59% |
| Hawaiian | 100% |
| Hispanic | 55% |
| International | 44% |
| Multi-Ethnic | 68% |
| White | 68% |
First-time, full-time students under the age of 25 are much more likely to graduate in four years. Some schools cater to mostly traditional students while others cater to 'non-traditional' students. So called 'non-traditional' students include part-time students or those who may be returning after an absense. It is common for part-time and/or adult students to take longer to graduate.
Traditional Students:
First-time, full-time students under the age of 25.
Non-Traditional Students:
Any student that is not first-time, full-time, and under the age of 25.
A meaningful share of students at QC are considered 'non-traditional students' who are not first-time, full-time, and under 25.
Comparing the graduation rates of the specific cohorts below can be more revealing than the overall graduation rates.
First-time / full-time students at CUNY Queens College represent 27.51% of the students in the class of 2023.
After six years, the QC graduation rate was 55%, and by the eight year mark, 59% of the cohort had completed their degree.
Nationwide, the average graduation rate for this group is 37.92% after four years, 46.43% after six years, and 47.82% after eight years.
| Completions | QC | Nationwide |
|---|---|---|
| Four Years | 29% | 37.92% |
| Six Years | 55% | 46.43% |
| Eight Years | 59% | 47.82% |
625 first-time / full-time students or 41% did not complete their degree within eight years.
Of those who did not finish:
25 are still enrolled.
373 transferred to another institution.
QC lost contact with the remaining 227 who we assumed dropped out.
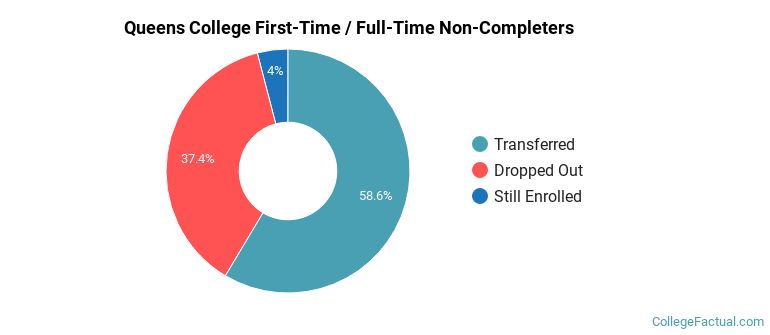
| Non-Completions | Undergraduates | Percentage |
|---|---|---|
| Still Enrolled | 25 | 4.00% |
| Transferred | 373 | 59.68% |
| Dropped Out | 227 | 36.32% |
First-time / part-time students at CUNY Queens College represent 0.57% of the students in the class of 2023.
After six years, the QC graduation rate was 28%, and by the eight year mark, 28% of the cohort had completed their degree.
Nationwide, the average graduation rate for this group is 14.37% after four years, 21.59% after six years, and 23.72% after eight years.
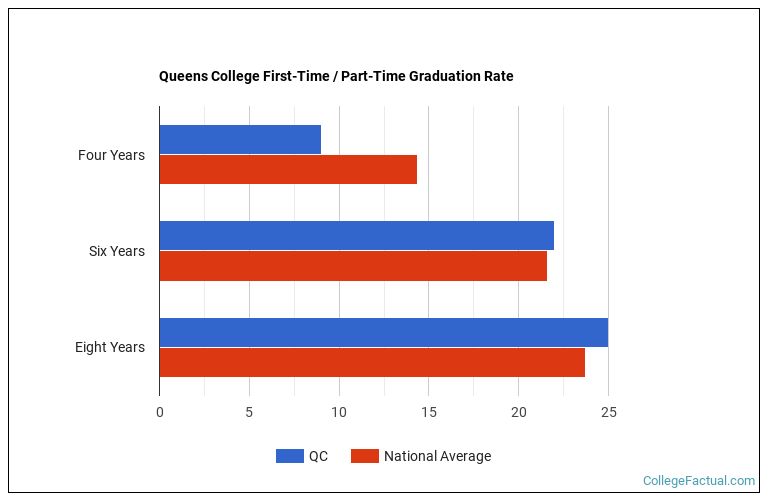
| Completions | QC | Nationwide |
|---|---|---|
| Four Years | 6% | 14.37% |
| Six Years | 28% | 21.59% |
| Eight Years | 28% | 23.72% |
23 first-time / part-time students or 72% did not complete their degree within eight years.
Of those who did not finish:
1 are still enrolled.
12 transferred to another institution.
QC lost contact with the remaining 10 who we assumed dropped out.
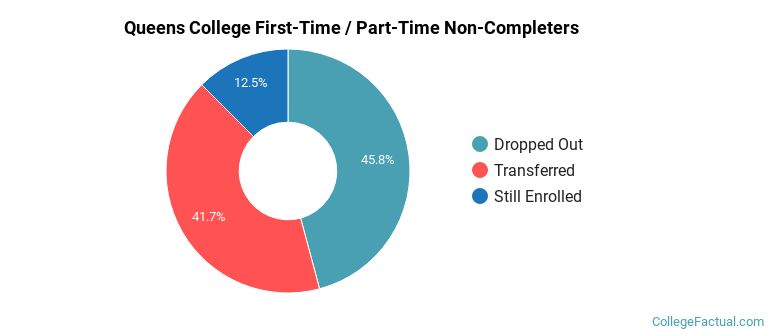
| Non-Completions | Undergraduates | Percentage |
|---|---|---|
| Still Enrolled | 1 | 4.35% |
| Transferred | 12 | 52.17% |
| Dropped Out | 10 | 43.48% |
Returning / full-time students at CUNY Queens College represent 55.17% of the students in the class of 2023.
After six years, the QC graduation rate was 59%, and by the eight year mark, 61% of the cohort had completed their degree.
Nationwide, the average graduation rate for this group is 53.83% after six years, and 55.07% after eight years.
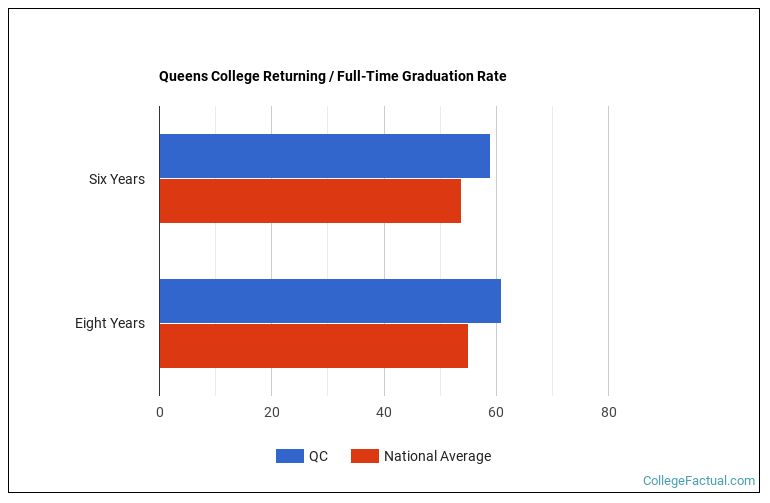
| Completions | QC | Nationwide |
|---|---|---|
| Four Years | 0% | 49.57% |
| Six Years | 59% | 53.83% |
| Eight Years | 61% | 55.07% |
1199 non first-time / part-time students or 39% did not complete their degree within eight years.
Of those who did not finish:
39 are still enrolled.
530 transferred to another institution.
QC lost contact with the remaining 630 who we assumed dropped out.
| Non-Completions | Undergraduates | Percentage |
|---|---|---|
| Still Enrolled | 39 | 3.25% |
| Transferred | 530 | 44.20% |
| Dropped Out | 630 | 52.54% |
Returning / part-time students at CUNY Queens College represent 16.75% of the students in the class of 2023.
After six years, the QC graduation rate was 34%, and by the eight year mark, 35% of the cohort had completed their degree.
Nationwide, the average graduation rate for this group is 30.46% after four years, 36.03% after six years, and 37.80% after eight years.
| Completions | QC | Nationwide |
|---|---|---|
| Four Years | 22% | 30.46% |
| Six Years | 34% | 36.03% |
| Eight Years | 35% | 37.80% |
606 non first-time / part-time students or 65% did not complete their degree within eight years.
Of those who did not finish:
14 are still enrolled.
255 transferred to another institution.
QC lost contact with the remaining 337 who we assumed dropped out.

| Non-Completions | Undergraduates | Percentage |
|---|---|---|
| Still Enrolled | 14 | 2.31% |
| Transferred | 255 | 42.08% |
| Dropped Out | 337 | 55.61% |
