Here is an overview of this program at ESU E-State. It is offered at the Bachelor’s level. Jump to any of the following sections:
The table below lists every degree level available for political science & government at ESU E-State, along with how many graduates complete each level annually.Degree Level Annual Graduates Bachelor’s 2
For the most recent IPEDS reporting year, Emporia State University awarded 2 bachelor’s degrees in political science & government.
ESU E-State is not currently ranked for political science & government at the bachelor’s level.
Average full-time tuition and fees are listed in the table below.In State Out of State Tuition $5,278 $13,855 Fees $1,564 $1,564
Learn more about ESU E-State tuition and fees.
In the most recent graduating class, 50% of political science & government bachelor’s degrees went to men and 50% went to women.
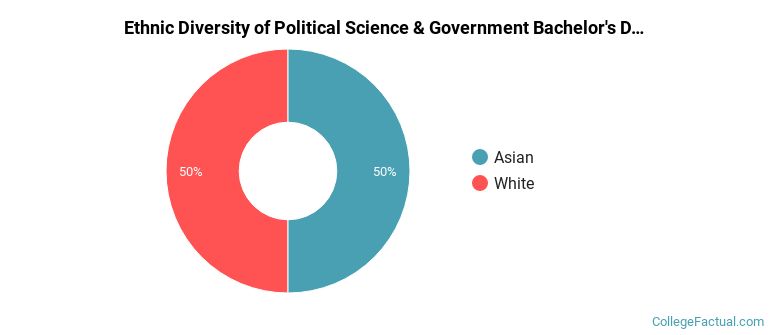
 The majority of political science & government bachelor’s degree graduates at ESU E-State were Asian. About 50% of graduates fell into this category.
The following table and chart show the ethnic background for students who recently graduated from Emporia State University with a bachelor’s in political science & government.
| Ethnic Background | Number of Students |
|---|---|
| Asian | 1 |
| Black or African American | 0 |
| Hispanic or Latino | 0 |
| White | 1 |
| Non-Resident Aliens | 0 |
| Other Races | 0 |
ESU E-State granted 2 bachelor’s degrees in political science and government, general in the latest year of data — 50% to women and 50% to men. The most common background among these graduates was Asian (50%).