Is Florida State really diverse? College Factual’s diversity report reveals the truth and stats about diversity at Florida State. We examined racial demographics, gender ratios, student age ranges, and where students come from.
What does diversity really mean at the college level? College Factual analyzed the data to find out how diverse the typical college campus really is, including race, gender, the ages of the students, and where they’re from.
Florida State total enrollment is approximately 36,430 students. 29,352 are undergraduates and 7,078 are graduate students.
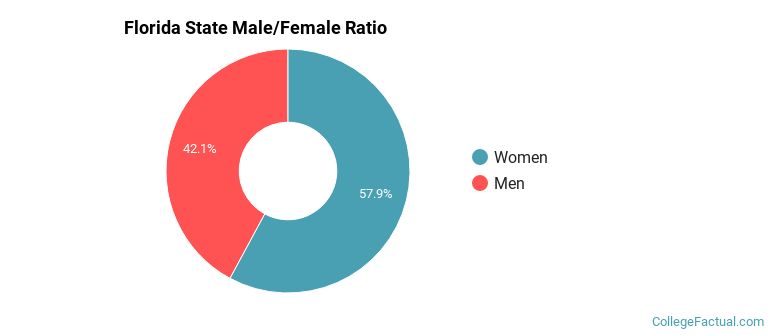
Male/Female Breakdown of Undergraduates
The full-time Florida State undergraduate population is made up of 57.5% women, and 42.5% men.
For the gender breakdown for all students, go here.
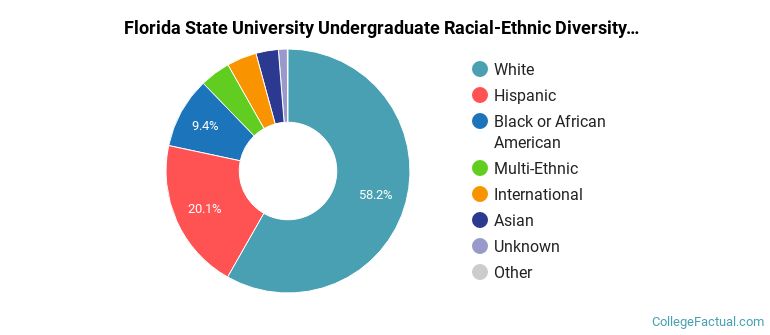
Florida State Racial/Ethnic Breakdown of Undergraduates
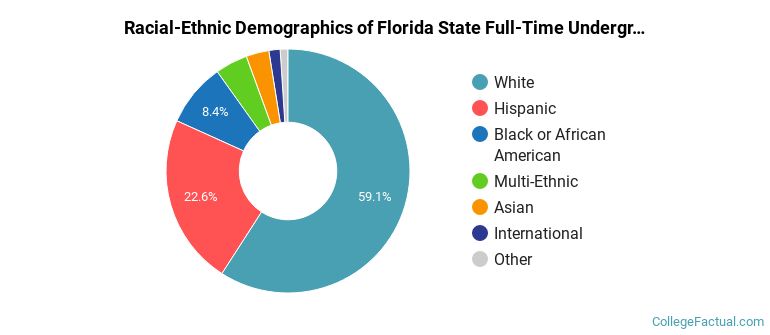
| Race/Ethnicity | Number | Percent |
|---|---|---|
| White | 17,066 | 58.2% |
| Hispanic | 6,794 | 23.2% |
| Black or African American | 2,121 | 7.2% |
| Multi-Ethnic | 1,268 | 4.3% |
| Asian | 1,078 | 3.7% |
| International | 574 | 2.0% |
| Unknown | 407 | 1.4% |
| Native Hawaiian or Pacific Islander | 18 | 0.1% |
See racial/ethnic breakdown for all students.
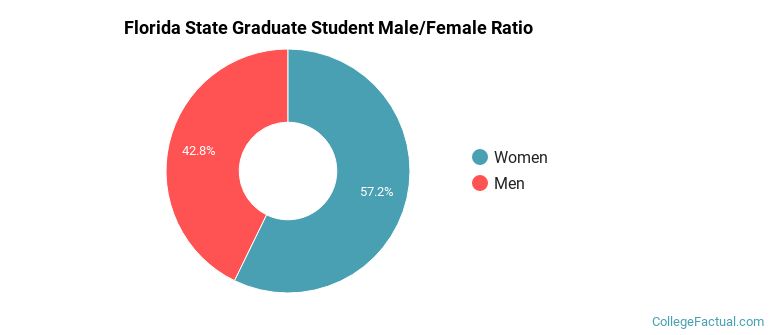
Male/Female Breakdown of Graduate Students
About 58.3% of full-time grad students are women, and 41.7% men.
For the gender breakdown for all students, go here.
Florida State Racial-Ethnic Breakdown of Graduate Students
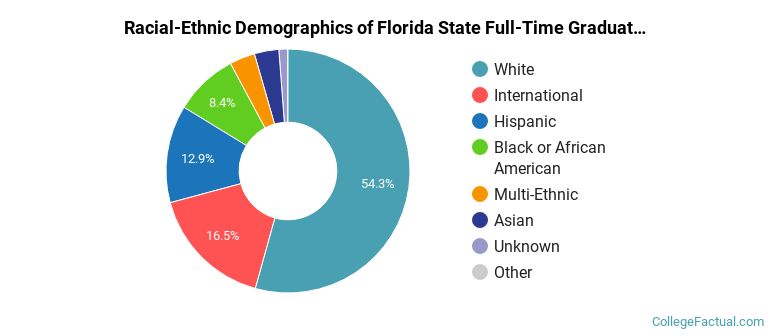
| Race/Ethnicity | Number | Percent |
|---|---|---|
| White | 3,344 | 47.3% |
| International | 1,591 | 22.5% |
| Hispanic | 918 | 13.0% |
| Black or African American | 646 | 9.1% |
| Asian | 276 | 3.9% |
| Multi-Ethnic | 231 | 3.3% |
| Unknown | 59 | 0.8% |
| Native Hawaiian or Pacific Islander | 2 | 0.0% |
See racial/ethnic breakdown for all students.
| Race/Ethnicity | Number | Percent |
|---|---|---|
| White | 20,410 | 56.1% |
| Hispanic | 7,712 | 21.2% |
| Black or African American | 2,767 | 7.6% |
| International | 2,165 | 5.9% |
| Multi-Ethnic | 1,499 | 4.1% |
| Asian | 1,354 | 3.7% |
| Unknown | 466 | 1.3% |
| Native Hawaiian or Pacific Islander | 20 | 0.1% |
Florida State University faculty racial/ethnic demographics (share of instructional staff):
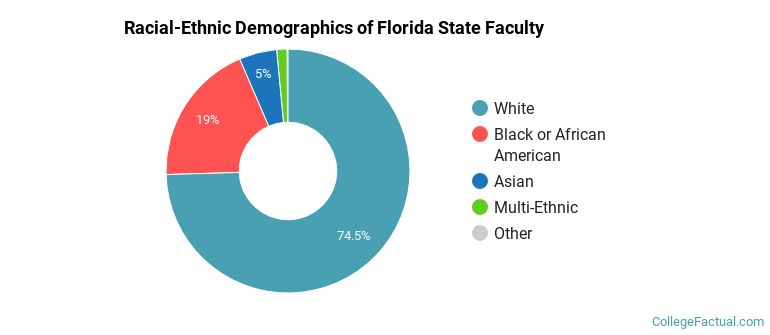
| Ethnicity | Percent of Faculty |
|---|---|
| White | 63.3% |
| Asian | 13.2% |
| International | 9.1% |
| Hispanic | 5.6% |
| Black or African American | 5.4% |
| Multi-Ethnic | 1.7% |
| Unknown | 1.5% |
| Native Hawaiian or Pacific Islander | 0.0% |
This school is more popular with women than with men.
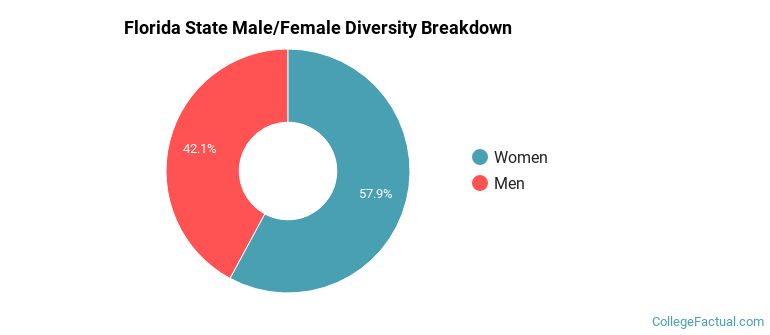
There are approximately 20,994 female students and 15,436 male students at Florida State.
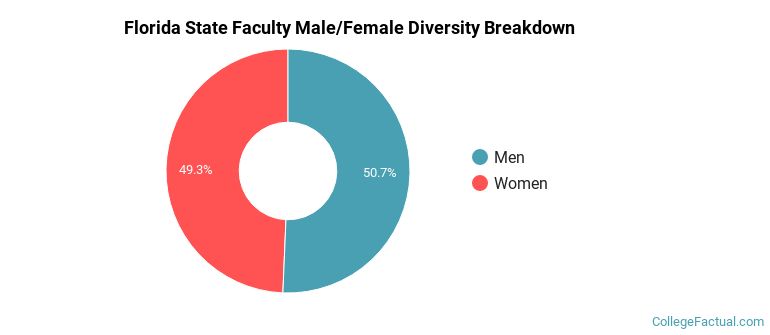
Florida State University faculty gender breakdown (share of instructional staff):
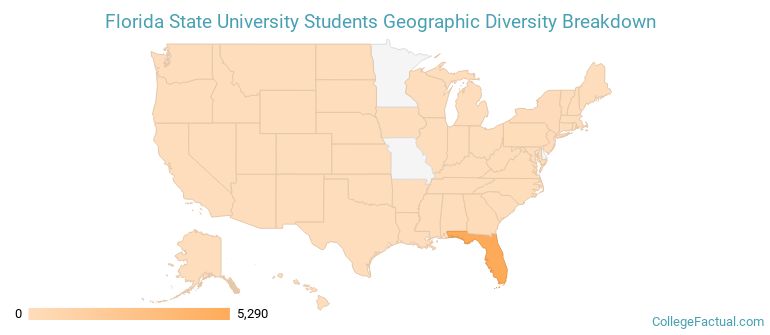
Among first-time degree-seeking undergraduates, 91.7% of Florida State students come from within the state, and 8.3% come from out of state.
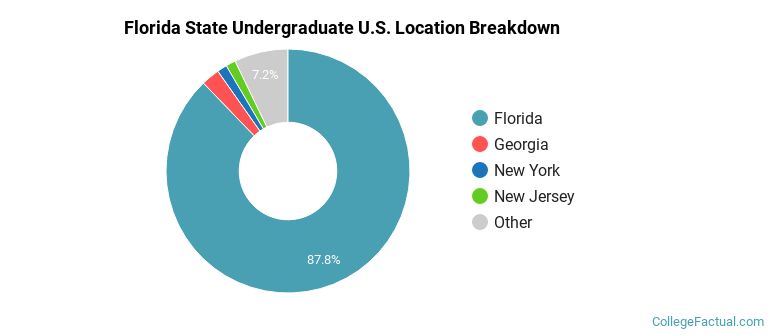
The undergraduate student body is split among 45 states (may include Washington D.C.). Click on the map for more detail.
| State | Amount | Percent |
|---|---|---|
| Florida | 4,667 | 80.8% |
| Georgia | 157 | 2.7% |
| New Jersey | 116 | 2.0% |
| New York | 101 | 1.7% |
| Illinois | 66 | 1.1% |
Florida State enrolls approximately 5.9% international (nonresident) students, contributing to the international character of the campus.
A traditional college student is defined as being between the ages of 18-21. At Florida State, 63.4% of undergraduate students fall into that category, compared to the national average of 60%.
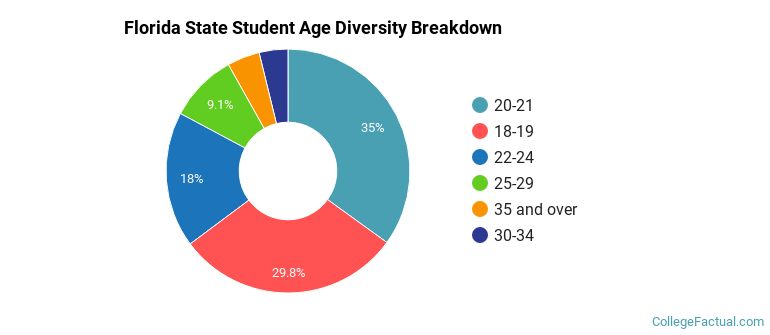
Student Age Group Amount Percent 20-21 15,933 36.3% 18-19 11,872 27.1% 22-24 7,260 16.5% 25-29 3,787 8.6% 35 and over 2,944 6.7% 30-34 1,761 4.0% Under 18 332 0.8%
Footnotes
*The racial-ethnic minorities count is calculated by taking the total number of students and subtracting white students, international students, and students whose race/ethnicity was unknown. This number is then divided by the total number of students at the school to obtain the racial-ethnic minorities percentage.
References