We've gathered data and other essential information about the program, such as the ethnicity of students, how many students graduated in recent times, and more. Also, learn how Harvard ranks among other schools offering degrees in anthropology.
Go directly to any of the following sections:
Ranked at #2 in College Factual's most recent rankings, Harvard is in the top 1% of the country for anthropology students pursuing a bachelor's degree. It is also ranked #1 in Massachusetts.
During the 2020-2021 academic year, Harvard University handed out 18 bachelor's degrees in anthropology. This is a decrease of 36% over the previous year when 28 degrees were handed out.
In 2021, 21 students received their master’s degree in anthropology from Harvard. This makes it the #4 most popular school for anthropology master’s degree candidates in the country.
In addition, 8 students received their doctoral degrees in anthropology in 2021, making the school the #16 most popular school in the United States for this category of students.
Learn about other programs related to Anthropology that might interest you.
Take a look at the following statistics related to the make-up of the anthropology majors at Harvard University.
During the 2020-2021 academic year, 18 students graduated with a bachelor's degree in anthropology from Harvard. About 44% were men and 56% were women.

The following table and chart show the ethnic background for students who recently graduated from Harvard University with a bachelor's in anthropology.
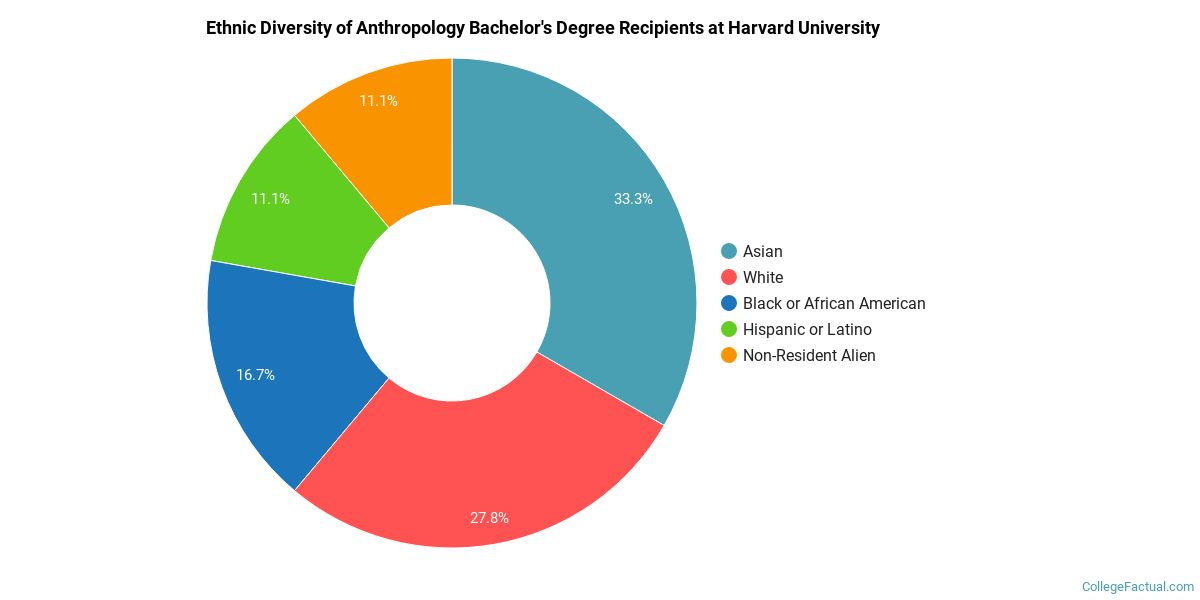
| Ethnic Background | Number of Students |
|---|---|
| Asian | 6 |
| Black or African American | 3 |
| Hispanic or Latino | 2 |
| White | 5 |
| Non-Resident Aliens | 2 |
| Other Races | 0 |
During the 2020-2021 academic year, 21 students graduated with a bachelor's degree in anthropology from Harvard. About 33% were men and 67% were women.

The following table and chart show the ethnic background for students who recently graduated from Harvard University with a master's in anthropology.
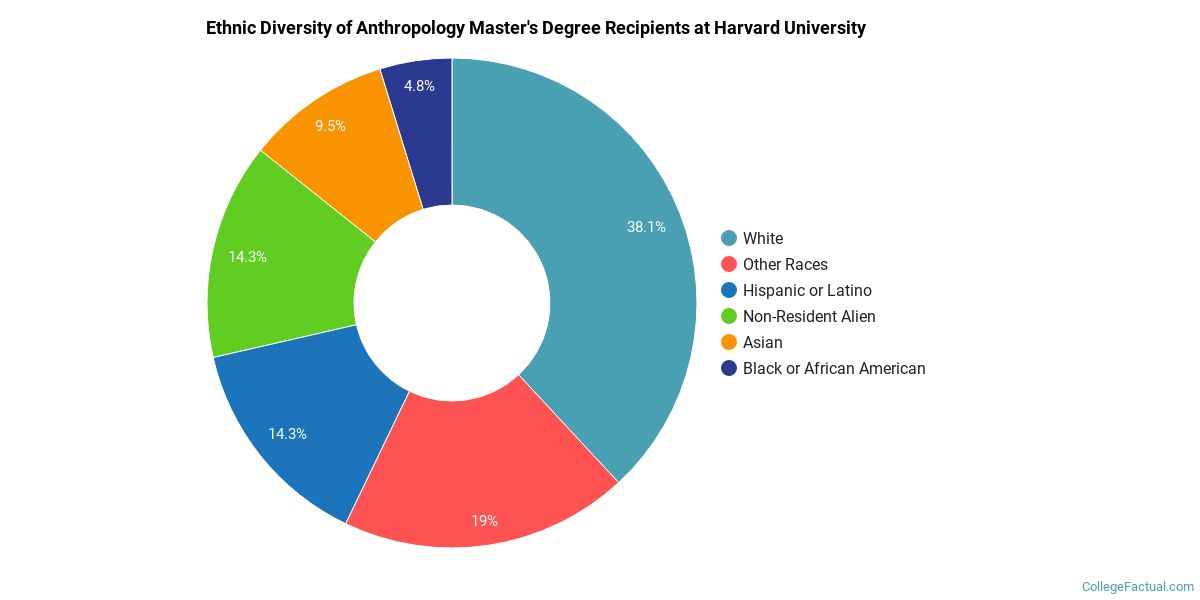
| Ethnic Background | Number of Students |
|---|---|
| Asian | 2 |
| Black or African American | 1 |
| Hispanic or Latino | 3 |
| White | 8 |
| Non-Resident Aliens | 3 |
| Other Races | 4 |
| Related Major | Annual Graduates |
|---|---|
| Economics | 267 |
| General Social Sciences | 188 |
| Political Science & Government | 157 |
| International Relations & National Security | 149 |
| Sociology | 63 |
More about our data sources and methodologies.