Is IU Bloomington really diverse? College Factual’s diversity report reveals the truth and stats about diversity at IU Bloomington. We reviewed racial demographics, gender ratios, student age ranges, and where students come from.
Many schools pride themselves on their diversity, but what does that mean, really? College Factual ran the numbers to discover how diverse the typical college campus really is, taking into account race, gender, the ages of the students, and where they’re from.
IU Bloomington total enrollment is approximately 43,825 students. 36,540 are undergraduates and 7,285 are graduate students.
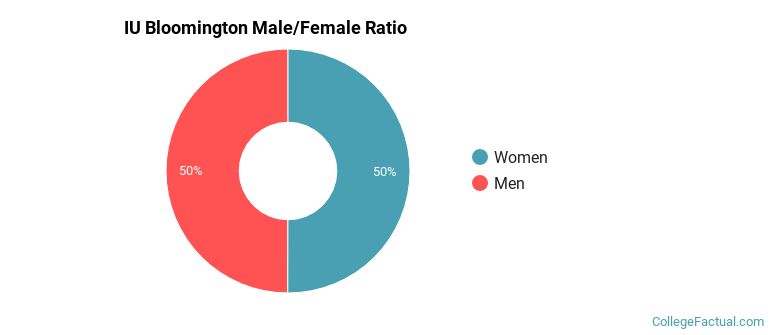
Male/Female Breakdown of Undergraduates
The full-time IU Bloomington undergraduate population is made up of 49.9% women, and 50.1% men.
For the gender breakdown for all students, go here.
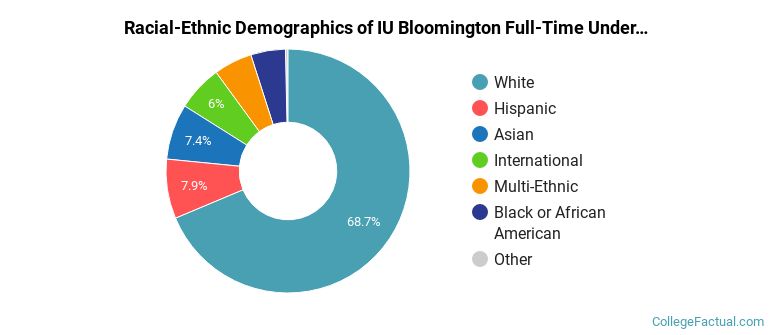
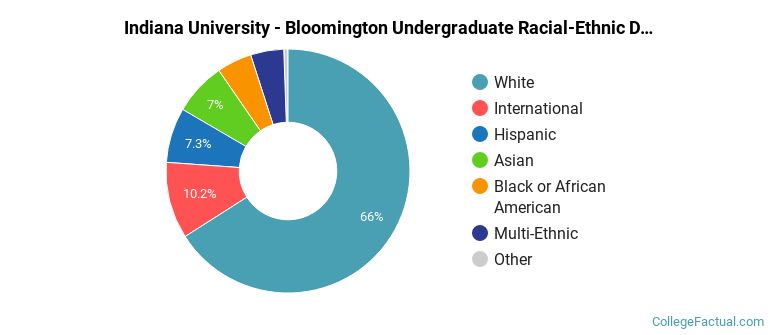
IU Bloomington Racial/Ethnic Breakdown of Undergraduates
| Race/Ethnicity | Number | Percent |
|---|---|---|
| White | 24,202 | 66.3% |
| Asian | 3,620 | 9.9% |
| Hispanic | 3,086 | 8.4% |
| Multi-Ethnic | 2,013 | 5.5% |
| International | 1,853 | 5.1% |
| Black or African American | 1,550 | 4.2% |
| Unknown | 195 | 0.5% |
| Native Hawaiian or Pacific Islander | 11 | 0.0% |
See racial/ethnic breakdown for all students.
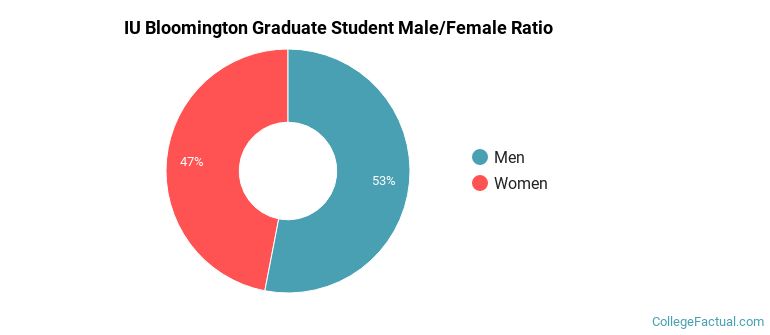
Male/Female Breakdown of Graduate Students
About 47.0% of full-time grad students are women, and 53.0% men.
For the gender breakdown for all students, go here.
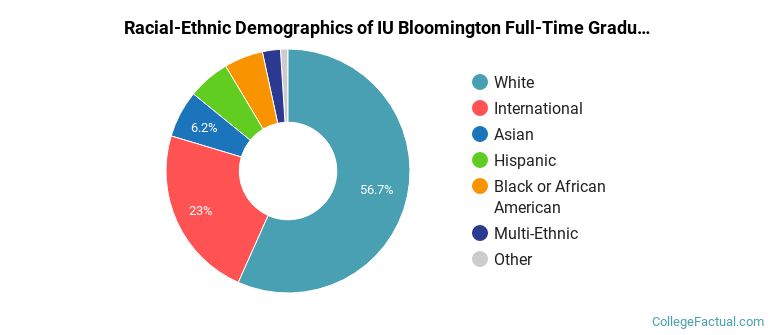
IU Bloomington Racial-Ethnic Breakdown of Graduate Students
| Race/Ethnicity | Number | Percent |
|---|---|---|
| White | 3,285 | 45.1% |
| International | 2,548 | 35.0% |
| Hispanic | 443 | 6.1% |
| Asian | 423 | 5.8% |
| Black or African American | 289 | 4.0% |
| Multi-Ethnic | 213 | 2.9% |
| Unknown | 79 | 1.1% |
| Native Hawaiian or Pacific Islander | 2 | 0.0% |
See racial/ethnic breakdown for all students.
| Race/Ethnicity | Number | Percent |
|---|---|---|
| White | 27,487 | 62.7% |
| International | 4,401 | 10.0% |
| Asian | 4,043 | 9.2% |
| Hispanic | 3,529 | 8.1% |
| Multi-Ethnic | 2,226 | 5.1% |
| Black or African American | 1,839 | 4.2% |
| Unknown | 274 | 0.6% |
| Native Hawaiian or Pacific Islander | 13 | 0.0% |
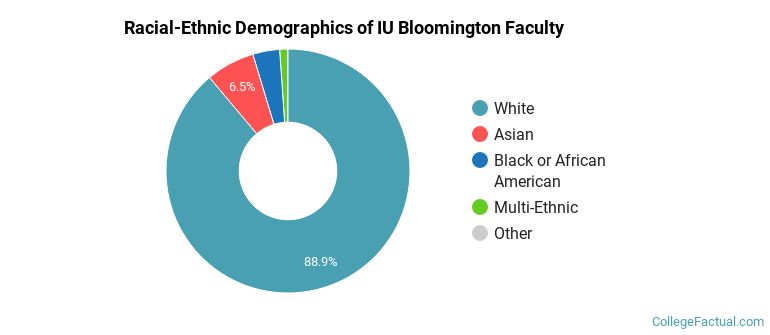
Indiana University-Bloomington faculty racial/ethnic demographics (share of instructional staff):
| Ethnicity | Percent of Faculty |
|---|---|
| White | 68.3% |
| International | 10.0% |
| Asian | 9.4% |
| Hispanic | 6.6% |
| Black or African American | 3.9% |
| Multi-Ethnic | 1.4% |
| Unknown | 0.3% |
| Native Hawaiian or Pacific Islander | 0.1% |
This school is more popular with men than with women.
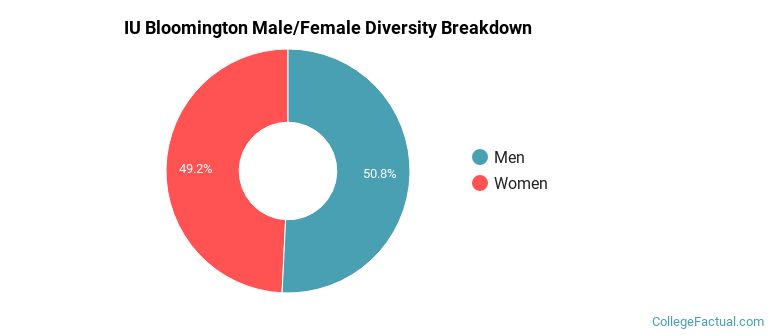
There are approximately 21,647 female students and 22,178 male students at IU Bloomington.
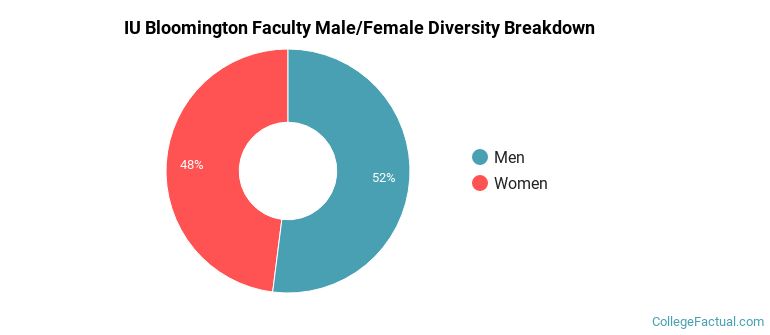
Indiana University-Bloomington faculty gender breakdown (share of instructional staff):
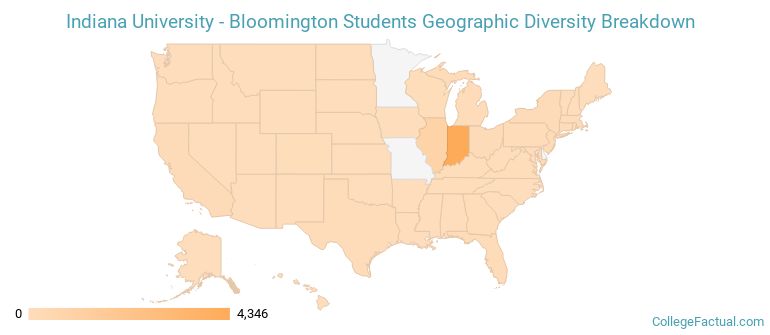
Among first-time degree-seeking undergraduates, 86.1% of IU Bloomington students come from within the state, and 13.9% come from out of state.
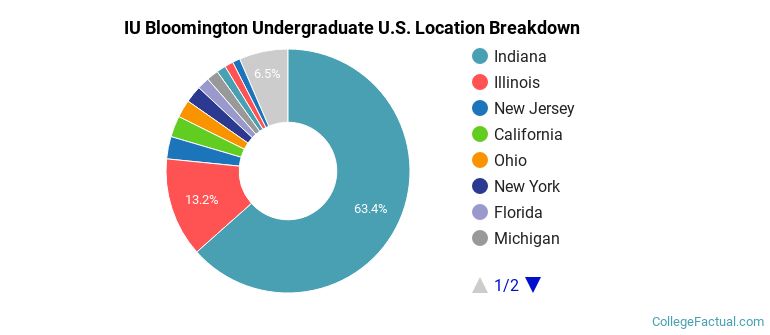
The undergraduate student body is split among 49 states (may include Washington D.C.). Click on the map for more detail.
| State | Amount | Percent |
|---|---|---|
| Indiana | 5,244 | 57.1% |
| Illinois | 862 | 9.4% |
| New Jersey | 456 | 5.0% |
| California | 381 | 4.1% |
| New York | 294 | 3.2% |
IU Bloomington hosts roughly 10.0% international (nonresident) students, contributing to the global diversity of the campus.
A traditional college student is defined as being between the ages of 18-21. At IU Bloomington, 71.8% of undergraduate students fall into that category, compared to the national average of 60%.
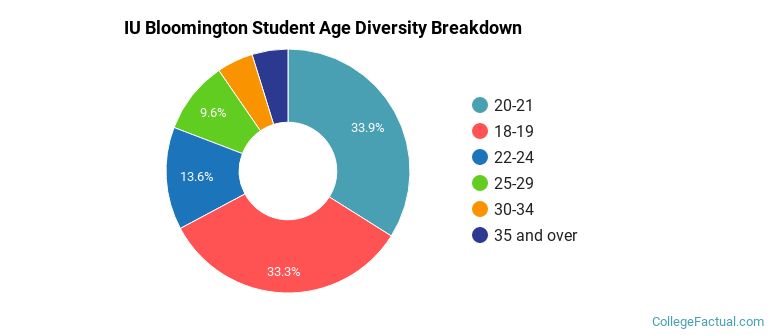
Student Age Group Amount Percent 18-19 17,529 36.2% 20-21 17,243 35.6% 22-24 5,560 11.5% 25-29 3,425 7.1% 35 and over 2,223 4.6% 30-34 1,836 3.8% Under 18 608 1.3%
Footnotes
*The racial-ethnic minorities count is calculated by taking the total number of students and subtracting white students, international students, and students whose race/ethnicity was unknown. This number is then divided by the total number of students at the school to obtain the racial-ethnic minorities percentage.
References