Below are the key facts about this program at John Brown University. Degrees are awarded at the Bachelor’s level. Jump to any of the following sections:
The following degree levels are available for finance & financial management at John Brown University, along with how many graduates complete each level annually.Degree Level Annual Graduates Bachelor’s 9
During the most recent reporting year, John Brown University handed out 9 bachelor’s degrees in finance & financial management.
John Brown University has not been ranked for finance & financial management at the bachelor’s level.
The full-time undergraduate tuition and fees are shown below.In State Out of State Tuition $27,662 $30,374 Fees $1,382 $1,382
Learn more about John Brown University tuition and fees.
In the most recent graduating class, 67% of finance & financial management bachelor’s degrees went to men and 33% went to women.
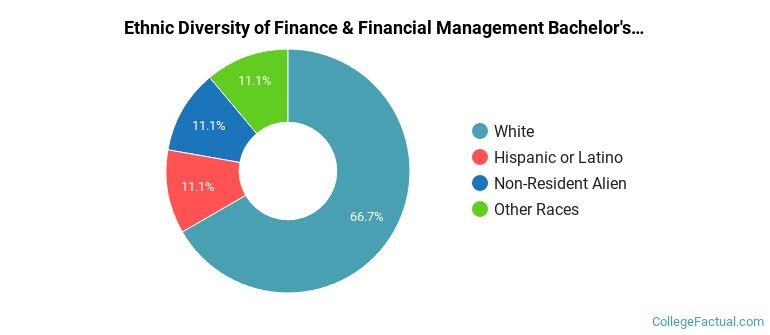
 The largest share of finance & financial management bachelor’s degree graduates at John Brown University are White. About 67% of graduates fell into this category.
The following table and chart show the ethnic background for students who recently graduated from John Brown University with a bachelor’s in finance & financial management.
| Ethnic Background | Number of Students |
|---|---|
| Asian | 0 |
| Black or African American | 0 |
| Hispanic or Latino | 1 |
| White | 6 |
| Non-Resident Aliens | 1 |
| Other Races | 1 |
John Brown University granted 9 bachelor’s completions in finance, general recently — 33% to women and 67% to men. The largest share of these graduates were White (67%).