Here is an overview of this program at KSC. You can study it at the Bachelor’s level. Jump to any of the following sections:
The table below lists every degree level granted in drama & theater arts at KSC, along with how many graduates complete each level annually.Degree Level Annual Graduates Bachelor’s 5
In the most recent year for which we have data, Keene State College conferred 5 bachelor’s degrees in drama & theater arts.
KSC is not currently ranked for drama & theater arts at the bachelor’s level.
Information about average full-time undergraduate tuition and fees is shown in the table below.In State Out of State Tuition $11,754 $23,810 Fees $3,030 $3,030
Learn more about KSC tuition and fees.
For the most recent academic year available, 60% of drama & theater arts bachelor’s degrees went to men and 40% went to women.
 The largest share of drama & theater arts bachelor’s degree graduates at KSC are White. Approximately 100% of graduates fell into this category.
The following table and chart show the ethnic background for students who recently graduated from Keene State College with a bachelor’s in drama & theater arts.
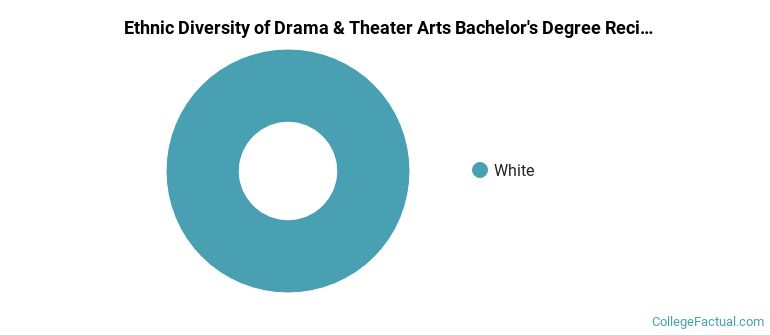
| Ethnic Background | Number of Students |
|---|---|
| Asian | 0 |
| Black or African American | 0 |
| Hispanic or Latino | 0 |
| White | 5 |
| Non-Resident Aliens | 0 |
| Other Races | 0 |
KSC conferred 2 bachelor’s completions in acting in the latest year of data — 100% to women and 0% to men. The largest share of these graduates were White (100%).
KSC granted 2 bachelor’s completions in technical theatre/theatre design and technology in the most recent reporting year — 0% to women and 100% to men. The largest share of these graduates were White (100%).
KSC granted 1 bachelor’s degree in directing and theatrical production in the most recent reporting year — 0% to women and 100% to men. Most of these graduates identified as White (100%).