Here is an overview of this program at Kent State University at Kent. Degrees are awarded at the Bachelor’s level, with graduate study also available. Its best result is a rank of #15 out of 19 schools (Bachelor’s level) by College Factual. Jump to any of the following sections:
By College Factual’s measure, Kent State University at Kent as a strong choice for fine & studio arts, ranked #498 out of 664 schools nationally.Ranking Rank Best Fine & Studio Arts Schools 498 of 664 Best Fine & Studio Arts Schools in Ohio 16 of 20 Best Fine & Studio Arts Schools in the Great Lakes Region 64 of 80
The table below lists every degree level granted in fine & studio arts at Kent State University at Kent, along with how many graduates complete each level annually.Degree Level Annual Graduates Bachelor’s 50 Master’s 14
During the most recent reporting year, Kent State University at Kent awarded 50 bachelor’s degrees in fine & studio arts.
Kent State University at Kent holds a strong position among schools offering fine & studio arts at the bachelor’s level. Specifically, it ranked #15 out of 19 schools by College Factual.
Fine & Studio Arts graduates with a bachelor’s degree from Kent State University at Kent go on to jobs where they make a median salary of $31,153 a year. This is lower than $52,827, the median for all majors at Kent State University at Kent.
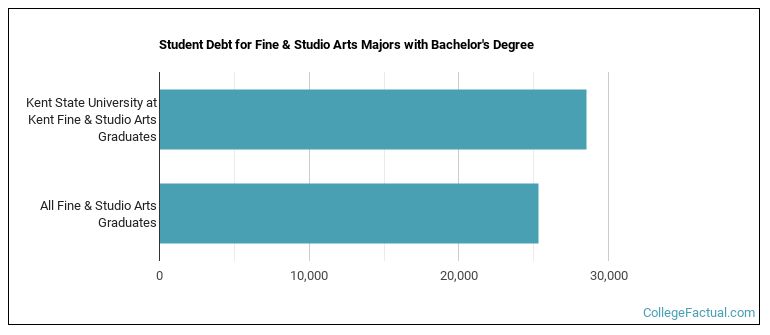
To complete a bachelor’s at Kent State University at Kent, fine & studio arts graduates take on a median debt of $28,501 in student loans. This is higher than $25,309, the typical median for all majors at Kent State University at Kent.
The full-time undergraduate tuition and fees are shown below.In State Out of State Tuition $11,774 $21,397 Fees $178 $178
Find out more about Kent State University at Kent tuition and fees.
For the most recent academic year available, 14% of fine & studio arts bachelor’s degrees went to men and 86% went to women.
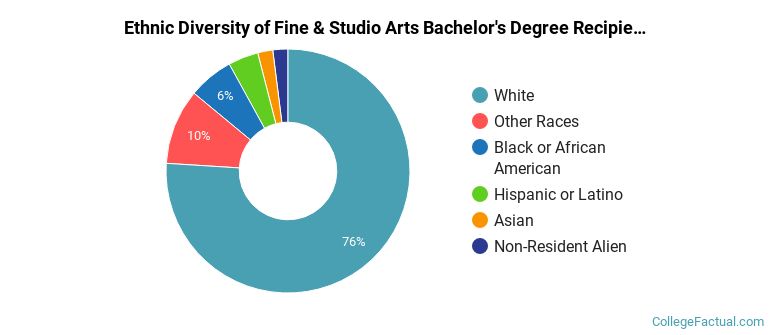
 The majority of fine & studio arts bachelor’s degree graduates at Kent State University at Kent are White. About 76% of graduates fell into this category.
The following table and chart show the ethnic background for students who recently graduated from Kent State University at Kent with a bachelor’s in fine & studio arts.
| Ethnic Background | Number of Students |
|---|---|
| Asian | 1 |
| Black or African American | 3 |
| Hispanic or Latino | 2 |
| White | 38 |
| Non-Resident Aliens | 1 |
| Other Races | 5 |
Kent State University at Kent conferred 42 bachelor’s completions in fine/studio arts, general in the latest year of data — 86% to women and 14% to men. The largest share of these graduates were White (74%).
Kent State University at Kent awarded 8 bachelor’s completions in art history, criticism and conservation in the most recent reporting year — 88% to women and 12% to men. Most of these graduates identified as White (88%).
This program is also offered at the graduate level at Kent State University at Kent. Annual graduate completions by level are shown below.Graduate Level Annual Graduates Master’s Degrees in Fine & Studio Arts 14
