Below are the key facts about this program at Lancaster Bible College. You can study it at the Bachelor’s, Associate’s levels, with graduate study also available. At its best it places at #24 out of 73 schools (Bachelor’s level) by College Factual. Jump to any of the following sections:
College Factual ranks Lancaster Bible College highly for business administration & management, placing at #626 out of 2,027 schools nationally.
The table below lists every degree level available for business administration & management at Lancaster Bible College, along with how many graduates complete each level annually.Degree Level Annual Graduates Bachelor’s 49 Associate’s 6 Master’s 2 Doctoral 8
For the most recent IPEDS reporting year, Lancaster Bible College conferred 49 bachelor’s degrees in business administration & management.
Lancaster Bible College ranks competitively among schools offering business administration & management at the bachelor’s level. In particular it placed #24 out of 73 schools by College Factual.
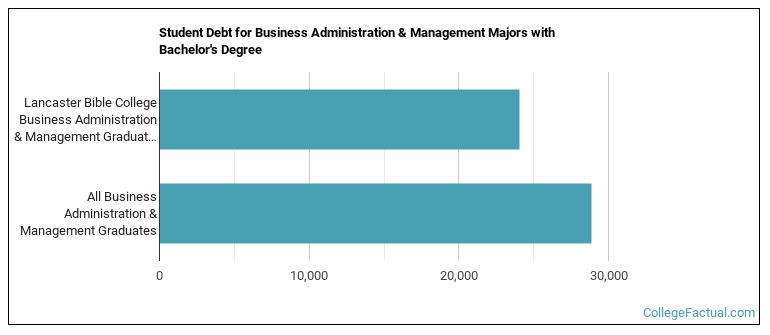
While getting their bachelor’s degree at Lancaster Bible College, business administration & management students accumulate a median of $24,062 in student loans. This is lower than $28,880, the typical median for all majors at Lancaster Bible College.
Average full-time tuition and fees are listed in the table below.In State Out of State Tuition $26,690 $29,990
Learn more about Lancaster Bible College tuition and fees.
In the most recent graduating class, 63% of business administration & management bachelor’s degrees went to men and 37% went to women.
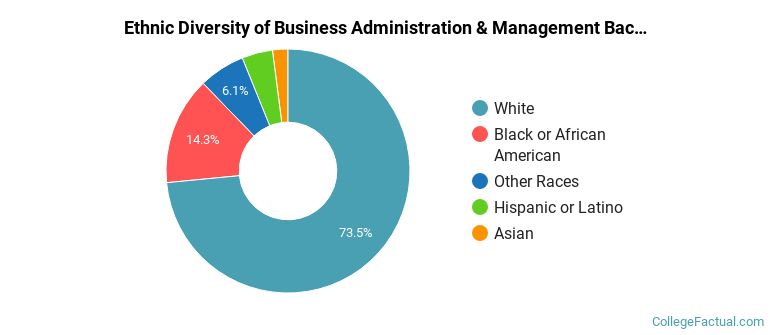
 The largest share of business administration & management bachelor’s degree graduates at Lancaster Bible College are White. Roughly 73% of graduates fell into this category.
The following table and chart show the ethnic background for students who recently graduated from Lancaster Bible College with a bachelor’s in business administration & management.
| Ethnic Background | Number of Students |
|---|---|
| Asian | 1 |
| Black or African American | 7 |
| Hispanic or Latino | 2 |
| White | 36 |
| Non-Resident Aliens | 0 |
| Other Races | 3 |
Lancaster Bible College awarded 49 bachelor’s completions in business administration, management and operations, other in the most recent reporting year — 37% to women and 63% to men. The largest share of these graduates were White (73%).
In the most recent year for which we have data, Lancaster Bible College handed out 6 associate’s degrees in business administration & management.
Lancaster Bible College is not yet ranked for business administration & management at the associate’s level.
Among recent graduates, 33% of business administration & management associate’s degrees went to men and 67% went to women.
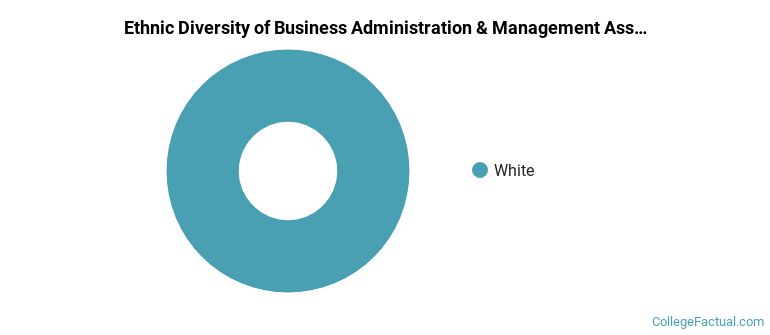
 The largest share of business administration & management associate’s degree graduates at Lancaster Bible College were White. Approximately 100% of graduates fell into this category.
The following table and chart show the ethnic background for students who recently graduated from Lancaster Bible College with a associate’s in business administration & management.
| Ethnic Background | Number of Students |
|---|---|
| Asian | 0 |
| Black or African American | 0 |
| Hispanic or Latino | 0 |
| White | 6 |
| Non-Resident Aliens | 0 |
| Other Races | 0 |
Lancaster Bible College awarded 6 associate’s completions in business administration, management and operations, other in the most recent reporting year — 67% to women and 33% to men. The most common background among these graduates was White (100%).
Graduate study is also available at Lancaster Bible College. Annual graduate completions by level are shown below.Graduate Level Annual Graduates Master’s Degrees in Business Administration & Management 2 Doctoral Degrees in Business Administration & Management 8
More about our data sources and methodologies.