If you want to know more about Lindenwood University, such as what majors does it offer, how diverse it is, how well it ranks, and more, this is your one-stop resource.

College Factual analyzes over 2,000 colleges and universities in its annual rankings and ranks them in a variety of ways, including most diverse, best overall quality, best for non-traditional students, and much more.
Lindenwood University was awarded 212 badges in the 2026 rankings.
College Factual ranked Lindenwood University as #1,001 out of 3,449 colleges and universities in the country on its 2026 Best Colleges list.
Lindenwood University also holds the #22 spot on the Best Colleges in Missouri ranking.
Lindenwood University has an acceptance rate of 57%, which means the school is serious about who it admits. Take your time in putting together a strong application that highlights why you are a good fit for Lindenwood University.
Lindenwood University received ACT scores from 6% of accepted students. When looking at the 25th through the 75th percentile, ACT Composite scores ranged between 22 and 28.
With a student to faculty ratio of 14 to 1, Lindenwood University is about average in this regard as the nationwide rate is 15 to 1. While this does not translate directly to class size, it’s a good indicator of how much time professors will have to spend with their students on a one-on-one basis.
Another measure that is often used to estimate how much access students will have to their professors is how many faculty members are full-time. The idea here is that part-time faculty tend to spend less time on campus, so they may not be as available to students as full-timers.
The full-time faculty percentage at Lindenwood University is 100%. This is higher than the national average of 47%.
Lindenwood University has a freshmen retention rate of 73%. That’s a good sign that full-time students like the school and their professors enough to want to stick around for another year. It’s also a sign that the admissions team did a good job in choosing applicants who were a good fit for the school.
Students are considered to have graduated on time if they finish their studies within four years. At Lindenwood University the on-time graduation rate of first-time, full-time students is 50%. That is great when compared to the national average of 33.3%.
Find out more about the retention and graduation rates at Lindenwood University.
In the current academic year, there are 4,748 undergraduates at Lindenwood University.
Get more detailed information on the diversity at Lindenwood University.
The overall average net price of Lindenwood University is $16,772. The affordability of the school largely depends on your financial need since net price varies by income group. See the table below for the net price for different income groups.### Net Price by Income Group for Lindenwood University$0-30 K $30K-48K $48-75 $75-110K $110K + $14,581 $15,129 $17,960 $18,796 $20,715
The net price is calculated by adding tuition, room, board and other costs and subtracting financial aid. Note that the net price is typically less than the published price for a school. For more information on the sticker price of Lindenwood University, see our tuition and fees and room and board pages.
While almost two-thirds of students nationwide take out loans to pay for college, the percentage may be quite different for the school you plan on attending. At Lindenwood University, approximately 49% of students took out student loans averaging $7,631 a year. That adds up to $30,524 over four years for those students. The student loan default rate is 2.9%. This is significantly lower than the national default rate of 10.1%, which is a good sign that you’ll be able to pay back your student loans. Get more details about paying for Lindenwood University.
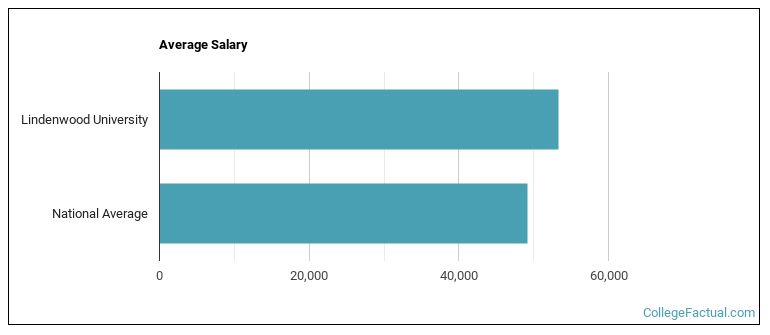
The pay for some majors is higher than others, but on average, students who graduate with a bachelor’s degree from Lindenwood University make about $53,278 a year during their first few years of employment after graduation. This is right on par with the average college graduate’s salary of $49,219 per year. Also, graduates in your major field may make more.
See which majors at Lindenwood University make the most money.
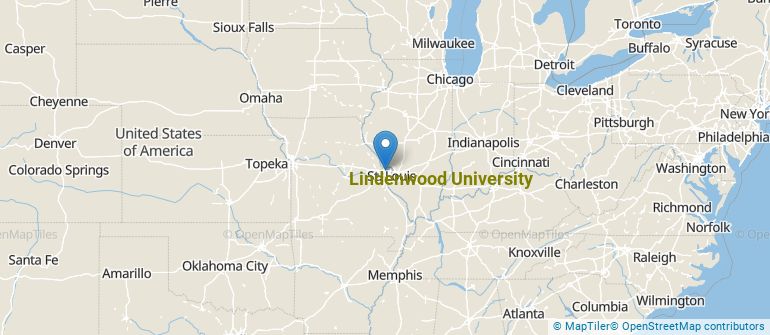
Lindenwood University is an private not-for-profit institution found in Saint Charles, Missouri. The surrounding area of the school is a good match for students who enjoy city life. Get more details about the location of Lindenwood University.
Get in touch with Lindenwood University are given below.Contact Details Address: 209 S Kingshighway St, Saint Charles, MO 63301-1695 Phone: 6369492000 Website: www.lindenwood.edu Facebook: www.facebook.com/LindenwoodUniversity Twitter: twitter.com/@LindenwoodU
During the most recent year for which we have data, students from 20 majors graduated from Lindenwood University. The following table lists the most popular undergraduate majors along with the average salary graduates from those majors make.Most Popular Majors Completions Average Salary of Graduates Multi-Disciplinary Studies 1,639 NA Business & Commerce 276 $50,420 Health & Physical Education 99 $29,348 Other Education 85 $42,298 Writing Studies 81 $36,614 Criminal Justice & Corrections 63 $33,954 General Psychology 60 $26,538 Computer Software Applications 58 $28,997 Fine & Studio Arts 51 $24,620 Educational Administration 48 $47,806
Online learning is becoming popular at even the oldest colleges and universities in the United States. Not only are online classes great for returning adults with busy schedules, they are also frequented by a growing number of traditional students.
4,095 students took at least one online class at Lindenwood University.
Footnotes
*The racial-ethnic minorities count is calculated by taking the total number of students and subtracting white students, international students, and students whose race/ethnicity was unknown. This number is then divided by the total number of students at the school to obtain the racial-ethnic minorities percentage.
References