Here, you'll find out more about the major, including such details as the number of graduates, what degree levels are offered, ethnicity of students, and more. In addition, we cover how LBCC ranks in comparison to other schools with agricultural production programs.
Jump to any of the following sections:
The agricultural production major at LBCC is not ranked on College Factual’s Best Colleges and Universities for Agricultural Production. This could be for a number of reasons, such as not having enough data on the major or school to make an accurate assessment of its quality.
During the 2022-2023 academic year, part-time undergraduate students at LBCC paid an average of $322 per credit hour if they came to the school from out-of-state. In-state students paid a discounted rate of $139 per credit hour.
The following table shows the average full-time tuition and fees for undergraduates.In State Out of State Tuition $5,817 $13,521 Fees $471 $471 Books and Supplies $1,777 $1,777
Learn more about LBCC tuition and fees.
Online degrees for the LBCC agricultural production bachelor’s degree program are not available at this time. To see if the school offers distance learning options in other areas, visit the LBCC Online Learning page.
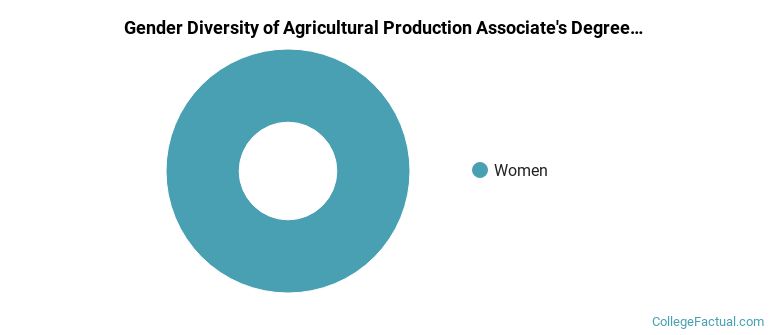
All of the 3 students who graduated with a Associate’s in agricultural production from LBCC in 2022 were women.
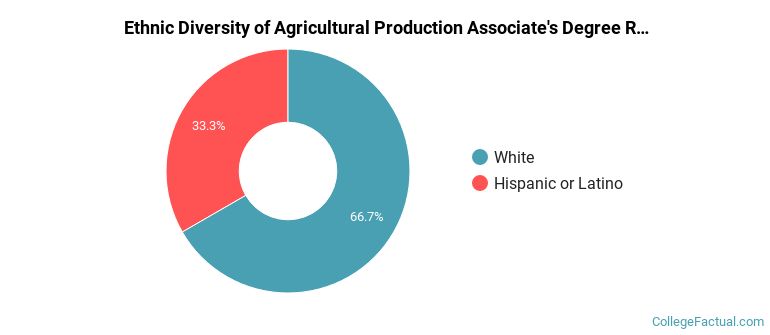
The majority of the students with this major are white. About 67% of 2022 graduates were in this category.
The following table and chart show the ethnic background for students who recently graduated from Linn-Benton Community College with a associate's in agricultural production.
| Ethnic Background | Number of Students |
|---|---|
| Asian | 0 |
| Black or African American | 0 |
| Hispanic or Latino | 1 |
| White | 2 |
| Non-Resident Aliens | 0 |
| Other Races | 0 |
| Related Major | Annual Graduates |
|---|---|
| Agricultural Economics & Business | 3 |
| General Agriculture | 2 |
| Animal Science | 1 |