Here is an overview of this program at McNeese. Degrees are awarded at the Bachelor’s level. It ranks as high as #4 out of 5 schools (Bachelor’s level) by College Factual. Jump to any of the following sections:
College Factual rates McNeese highly for clinical/medical laboratory science, ranked #181 out of 218 schools nationally.
The table below lists every degree level available for clinical/medical laboratory science at McNeese, along with how many graduates complete each level annually.Degree Level Annual Graduates Bachelor’s 18
During the most recent reporting year, McNeese State University handed out 18 bachelor’s degrees in clinical/medical laboratory science.
McNeese holds a strong position among schools offering clinical/medical laboratory science at the bachelor’s level. In particular it placed #4 out of 5 schools by College Factual.
Information about average full-time undergraduate tuition and fees is shown in the table below.In State Out of State Tuition $5,147 $6,647 Fees $3,342 $3,342
Read more about McNeese tuition and fees.
For the most recent academic year available, 22% of clinical/medical laboratory science bachelor’s degrees went to men and 78% went to women.
 The largest share of clinical/medical laboratory science bachelor’s degree graduates at McNeese are White. Approximately 44% of graduates fell into this category.
The following table and chart show the ethnic background for students who recently graduated from McNeese State University with a bachelor’s in clinical/medical laboratory science.
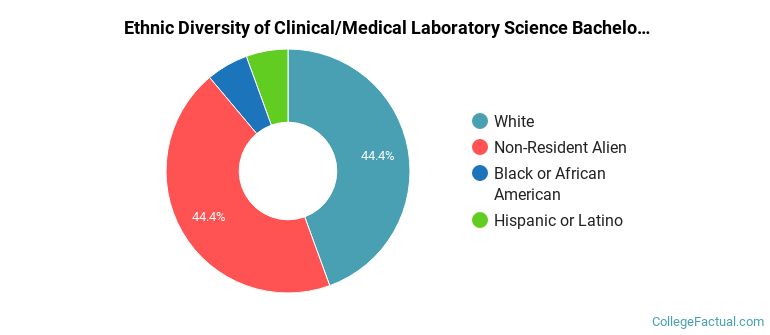
| Ethnic Background | Number of Students |
|---|---|
| Asian | 0 |
| Black or African American | 1 |
| Hispanic or Latino | 1 |
| White | 8 |
| Non-Resident Aliens | 8 |
| Other Races | 0 |
McNeese granted 18 bachelor’s completions in clinical laboratory science/medical technology/technologist in the latest year of data — 78% to women and 22% to men. The largest share of these graduates were White (44%).