Below are the key facts about this program at Oberlin College. You can study it at the Bachelor’s level. Its best result is a rank of #12 out of 22 schools (Bachelor’s level) by College Factual. Jump to any of the following sections:
By College Factual’s measure, Oberlin College highly for political science & government, placing at #385 out of 679 schools nationally.
The following degree levels are offered in political science & government at Oberlin College, along with how many graduates complete each level annually.Degree Level Annual Graduates Bachelor’s 37
In the most recent year for which we have data, Oberlin College awarded 37 bachelor’s degrees in political science & government.
Oberlin College is a solid choice among schools offering political science & government at the bachelor’s level. Specifically, it ranked #12 out of 22 schools by College Factual.
Political Science & Government graduates with a bachelor’s degree from Oberlin College go on to jobs where they make a median salary of $51,717 a year. This is higher than $34,513, the median for all majors at Oberlin College.
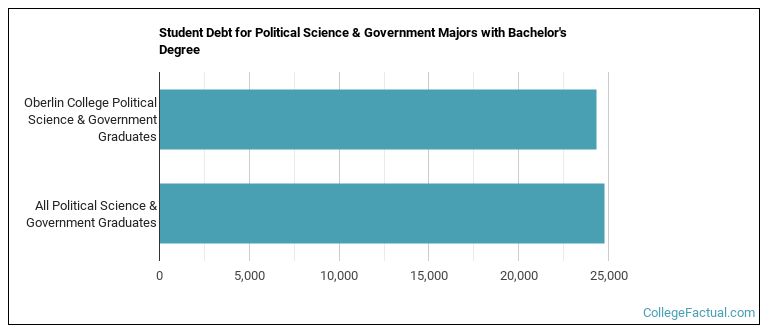
To complete a bachelor’s at Oberlin College, political science & government graduates take on a median debt of $24,314 in student loans. This is below $24,759, the typical median for all majors at Oberlin College.
Average full-time tuition and fees are listed in the table below.In State Out of State Tuition $59,384 $66,410 Fees $956 $956
Read more about Oberlin College tuition and fees.
In the most recent graduating class, 46% of political science & government bachelor’s degrees went to men and 54% went to women.
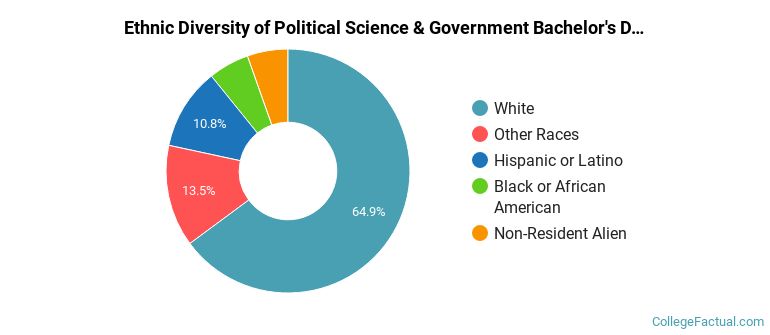
 The majority of political science & government bachelor’s degree graduates at Oberlin College are White. About 65% of graduates fell into this category.
The following table and chart show the ethnic background for students who recently graduated from Oberlin College with a bachelor’s in political science & government.
| Ethnic Background | Number of Students |
|---|---|
| Asian | 0 |
| Black or African American | 2 |
| Hispanic or Latino | 4 |
| White | 24 |
| Non-Resident Aliens | 2 |
| Other Races | 5 |
Oberlin College granted 37 bachelor’s completions in political science and government, general in the most recent reporting year — 54% to women and 46% to men. The most common background among these graduates was White (65%).
