Make an informed decision about your education by understanding Pace University retention and graduation rates. First year retention rates let you know how many first-time, full-time students students come back for their second year. Graduation rates tell you how many students complete their degree and how long it takes.
The percentage of first-time / full-time students who return for their second year is tracked as the freshmen retention rate.
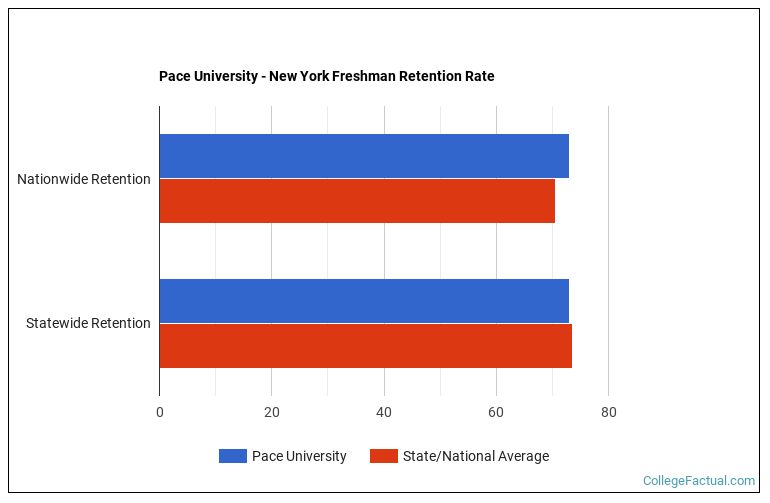
With 75% students making it past their freshmen year, Pace University has freshmen retention rates above the national average.
Nationwide, the average first to second year retention rate is 70.57%.
When looking at just colleges and universities in New York, the average is 73.51%.
| Retention Rate | |
|---|---|
| Pace University | 75% |
| Nationwide | 70.57% |
| New York | 73.51% |
Of the 1784 students in the class of 2023, how many completed their degree on time?
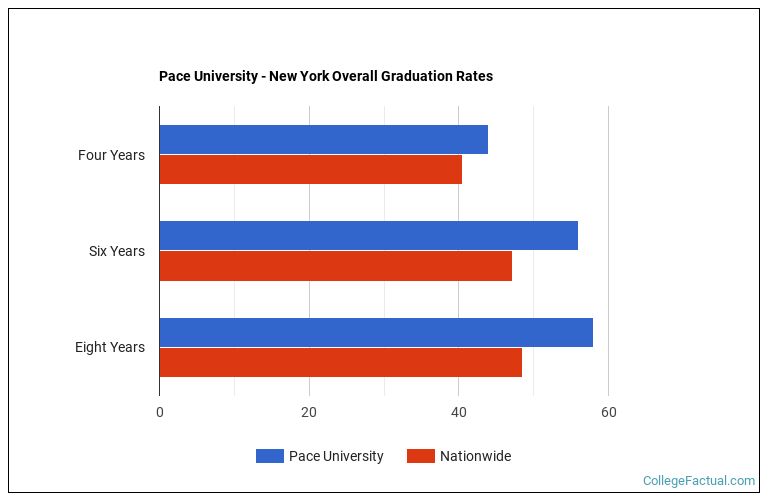
Four years after beginning their degree, 52% of those students had graduated. By 2025, six years after starting their degree, 62% of the students had graduated and after eight years 63% of this class completed their degree.
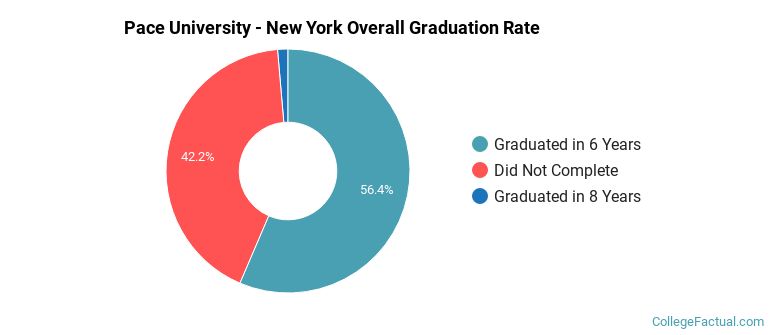
Any student who completes their bachelor's degree within six years is considered to have graduated on time, according to the National Center for Education Statistics. This makes the offical Pace University graduation rate 62%.
| Completion Within | Undergraduates | Percentage |
|---|---|---|
| Four Years | 1507 | 52% |
| Six Years | 1784 | 62% |
| Eight Years | 30 | 1% |
| Did Not Complete | 1068 | 37% |
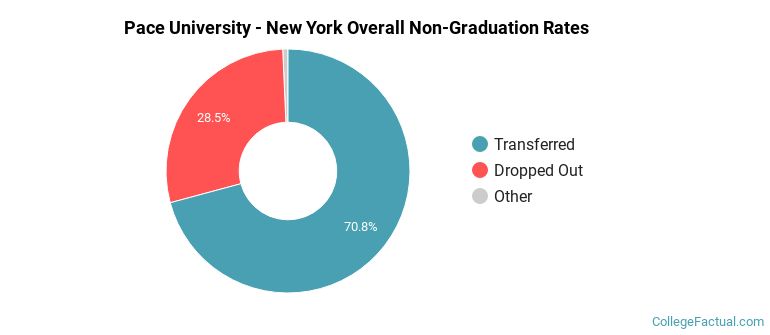
The non-completers rate is anyone who is not still enrolled at the institution after eight years. Both transfer students and drop-outs could be included in this group.
Approximately 1068 students or 37% of the cohort did not complete their degree within eight years.
What happened to the 1068 students who did not complete their degree?
2 are still enrolled.
655 transferred to another institution.
Pace University lost contact with the remaining 410 who we assumed dropped out.
| Non-Completions | Undergraduates | Percentage |
|---|---|---|
| Still Enrolled | 2 | 0.2% |
| Transferred | 655 | 61.3% |
| Dropped Out | 410 | 38.4% |

| Race/Ethnicity | Graduation Rate |
|---|---|
| American Indian or Alaskan Native | 80% |
| Asian | 65% |
| Black / African-American | 48% |
| Hispanic | 53% |
| International | 58% |
| Multi-Ethnic | 59% |
| Unknown | 60% |
| White | 66% |
First-time, full-time students under the age of 25 are much more likely to graduate in four years. Some schools cater to mostly traditional students while others cater to 'non-traditional' students. So called 'non-traditional' students include part-time students or those who may be returning after an absense. It is common for part-time and/or adult students to take longer to graduate.
Traditional Students:
First-time, full-time students under the age of 25.
Non-Traditional Students:
Any student that is not first-time, full-time, and under the age of 25.
The majority of students at Pace University are considered 'traditional students' who are first-time attending full-time.
Examining the graduation rates of the specific cohorts shown below may be more revealing than looking at the overall graduaton rates.
First-time / full-time students at Pace University represent 69.15% of the students in the class of 2023.
After six years, the Pace University graduation rate was 61%, and by the eight year mark, 62% of the cohort had completed their degree.
Nationwide, the average graduation rate for this group is 37.92% after four years, 46.43% after six years, and 47.82% after eight years.
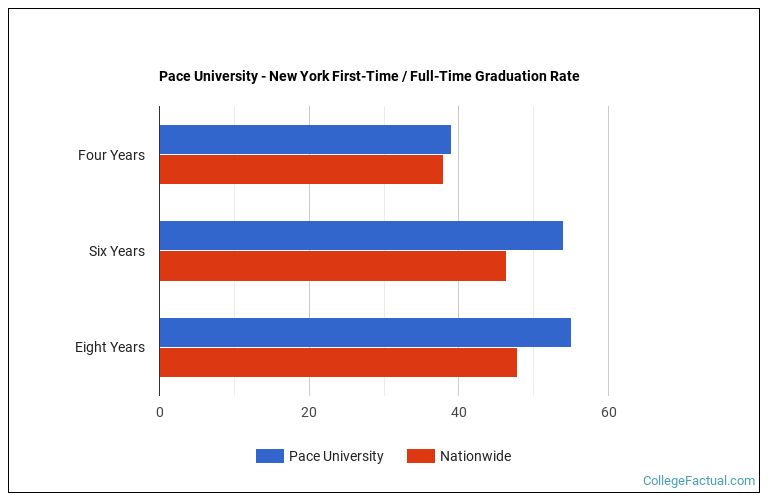
| Completions | Pace University | Nationwide |
|---|---|---|
| Four Years | 49% | 37.92% |
| Six Years | 61% | 46.43% |
| Eight Years | 62% | 47.82% |
759 first-time / full-time students or 38% did not complete their degree within eight years.
Of those who did not finish:
2 are still enrolled.
512 transferred to another institution.
Pace University lost contact with the remaining 245 who we assumed dropped out.
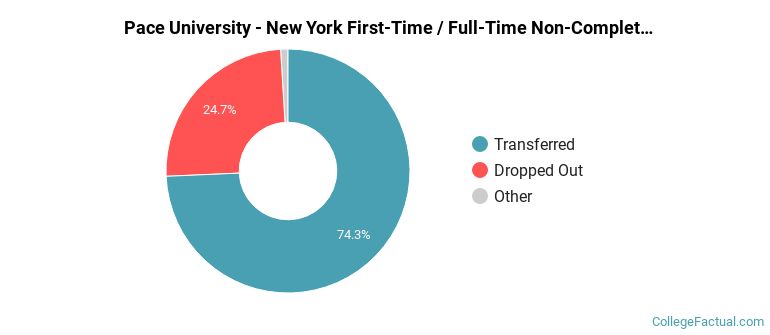
| Non-Completions | Undergraduates | Percentage |
|---|---|---|
| Still Enrolled | 2 | 0.26% |
| Transferred | 512 | 67.46% |
| Dropped Out | 245 | 32.28% |
First-time / part-time students at Pace University represent 2.95% of the students in the class of 2023.
After six years, the Pace University graduation rate was 48%, and by the eight year mark, 49% of the cohort had completed their degree.
Nationwide, the average graduation rate for this group is 14.37% after four years, 21.59% after six years, and 23.72% after eight years.
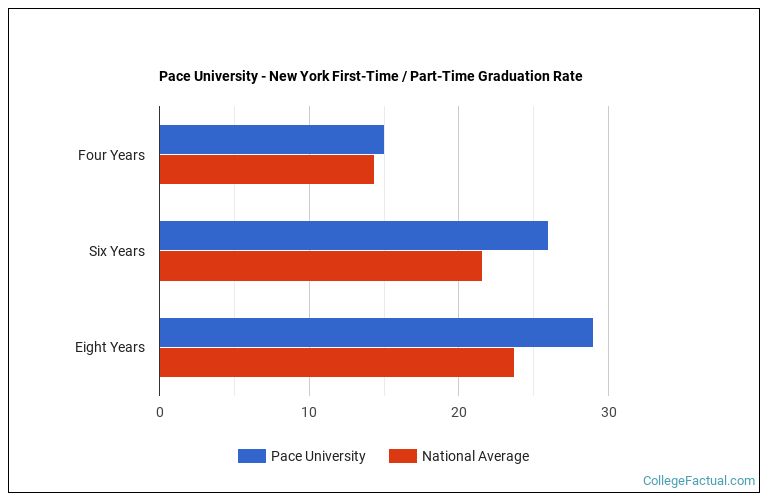
| Completions | Pace University | Nationwide |
|---|---|---|
| Four Years | 35% | 14.37% |
| Six Years | 48% | 21.59% |
| Eight Years | 49% | 23.72% |
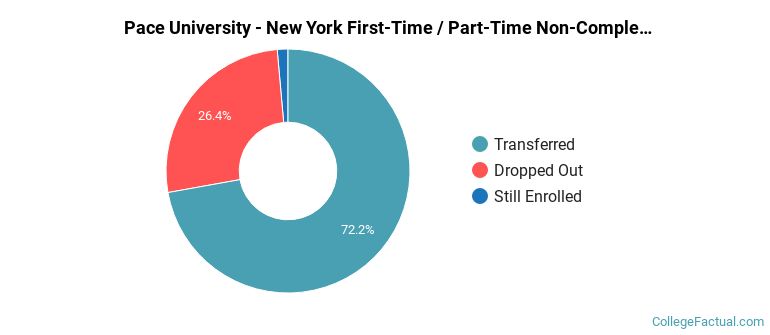
43 first-time / part-time students or 51% did not complete their degree within eight years.
Of those who did not finish:
1 are still enrolled.
6 transferred to another institution.
Pace University lost contact with the remaining 36 who we assumed dropped out.
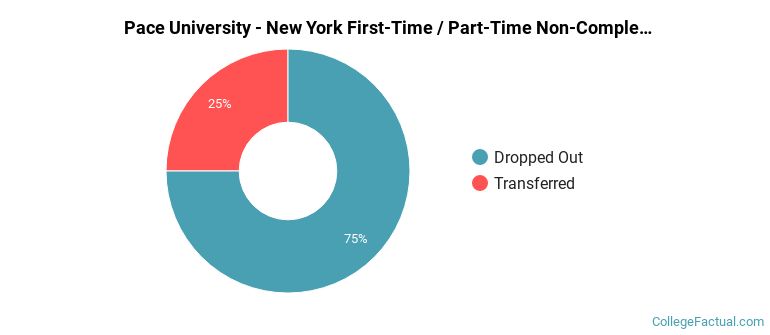
| Non-Completions | Undergraduates | Percentage |
|---|---|---|
| Still Enrolled | 1 | 2.33% |
| Transferred | 6 | 13.95% |
| Dropped Out | 36 | 83.72% |
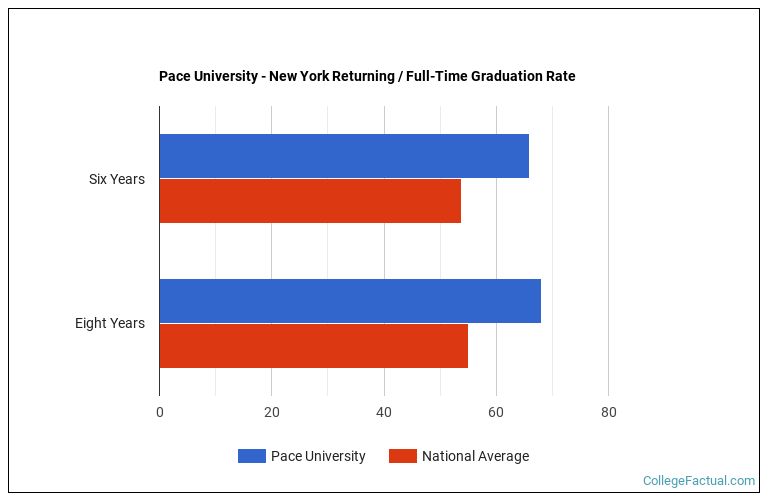
Returning / full-time students at Pace University represent 22.11% of the students in the class of 2023.
After six years, the Pace University graduation rate was 70%, and by the eight year mark, 71% of the cohort had completed their degree.
Nationwide, the average graduation rate for this group is 53.83% after six years, and 55.07% after eight years.
| Completions | Pace University | Nationwide |
|---|---|---|
| Four Years | 0% | 49.57% |
| Six Years | 70% | 53.83% |
| Eight Years | 71% | 55.07% |
186 non first-time / part-time students or 29% did not complete their degree within eight years.
Of those who did not finish:
0 are still enrolled.
110 transferred to another institution.
Pace University lost contact with the remaining 76 who we assumed dropped out.
| Non-Completions | Undergraduates | Percentage |
|---|---|---|
| Still Enrolled | 0 | 0.00% |
| Transferred | 110 | 59.14% |
| Dropped Out | 76 | 40.86% |
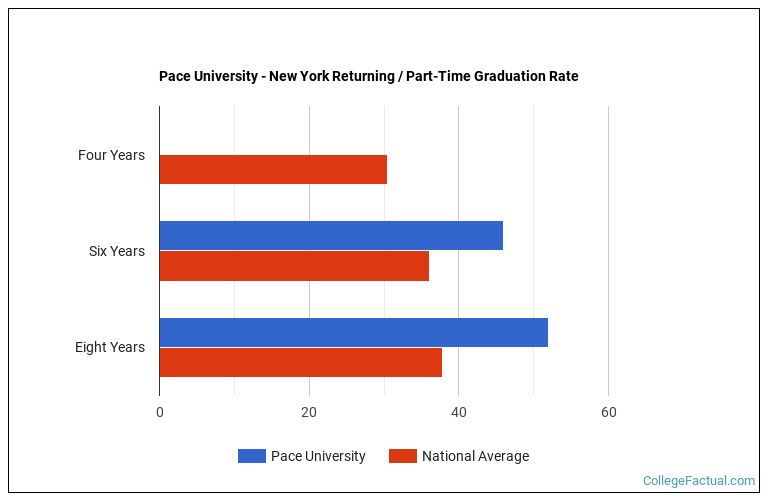
Returning / part-time students at Pace University represent 5.79% of the students in the class of 2023.
After six years, the Pace University graduation rate was 49%, and by the eight year mark, 52% of the cohort had completed their degree.
Nationwide, the average graduation rate for this group is 30.46% after four years, 36.03% after six years, and 37.80% after eight years.
| Completions | Pace University | Nationwide |
|---|---|---|
| Four Years | 41% | 30.46% |
| Six Years | 49% | 36.03% |
| Eight Years | 52% | 37.80% |
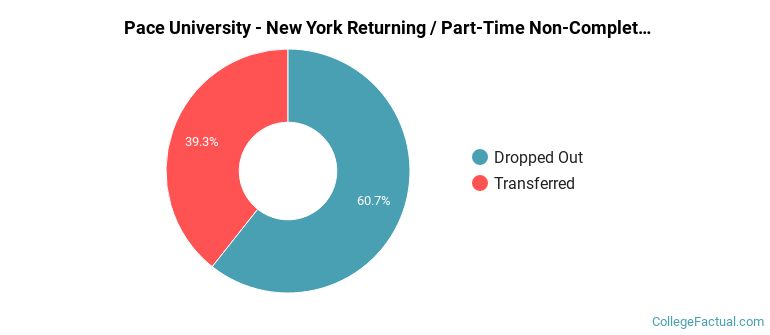
80 non first-time / part-time students or 48% did not complete their degree within eight years.
Of those who did not finish:
0 are still enrolled.
27 transferred to another institution.
Pace University lost contact with the remaining 53 who we assumed dropped out.
| Non-Completions | Undergraduates | Percentage |
|---|---|---|
| Still Enrolled | 0 | 0.00% |
| Transferred | 27 | 33.75% |
| Dropped Out | 53 | 66.25% |
