Here is an overview of this program at Portland State University. It is offered at the Bachelor’s level. At its best it places at #1 out of 2 schools (Bachelor’s level) by College Factual. Jump to any of the following sections:
College Factual ranks Portland State University among the top schools in the country for health sciences & services, ranked #79 out of 440 schools nationally.Ranking Rank Best Health Sciences & Services Schools 79 of 440 Best Health Sciences & Services Schools in Oregon 1 of 3
The table below lists every degree level available for health sciences & services at Portland State University, along with how many graduates complete each level annually.Degree Level Annual Graduates Bachelor’s 128
For the most recent IPEDS reporting year, Portland State University handed out 128 bachelor’s degrees in health sciences & services.
Portland State University is among the very best schools in the country for health sciences & services at the bachelor’s level. In particular it placed #1 out of 2 schools by College Factual.
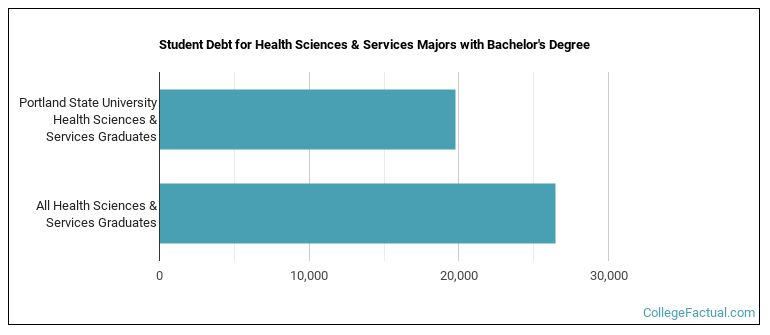
Earning a bachelor’s degree at Portland State University, health sciences & services students accumulate a median of $19,750 in student loans. This is lower than $26,475, the typical median for all majors at Portland State University.
The full-time undergraduate tuition and fees are shown below.In State Out of State Tuition $8,685 $27,132 Fees $2,004 $2,004
Read more about Portland State University tuition and fees.
Among recent graduates, 33% of health sciences & services bachelor’s degrees went to men and 67% went to women.
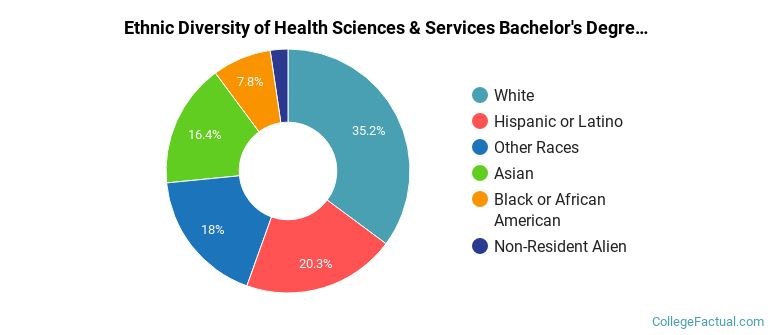
 The majority of health sciences & services bachelor’s degree graduates at Portland State University were White. About 35% of graduates fell into this category.
The following table and chart show the ethnic background for students who recently graduated from Portland State University with a bachelor’s in health sciences & services.
| Ethnic Background | Number of Students |
|---|---|
| Asian | 21 |
| Black or African American | 10 |
| Hispanic or Latino | 26 |
| White | 45 |
| Non-Resident Aliens | 3 |
| Other Races | 23 |
Portland State University conferred 91 bachelor’s degrees in health services/allied health/health sciences, general in the most recent reporting year — 74% to women and 26% to men. The largest share of these graduates were White (33%).
Portland State University granted 37 bachelor’s degrees in health and wellness, general recently — 51% to women and 49% to men. Most of these graduates identified as White (41%).