We've pulled together some essential information you should know about the program, including how many students graduate each year, the ethnic diversity of these students, and more. We've also included details on how Quincy College ranks compared to other colleges offering a major in criminal justice.
Jump to any of the following sections:
The bachelor's program at Quincy College was ranked #238 on College Factual's Best Schools for criminal justice list.
Part-time undergraduates at Quincy College paid an average of $265 per credit hour in 2022-2023. This tuition was the same for both in-state and out-of-state students.
The following table shows the average full-time tuition and fees for undergraduates.In State Out of State Tuition $6,360 $6,360 Fees $1,176 $1,176 Books and Supplies $2,000 $2,000
Learn more about Quincy College tuition and fees.
Online degrees for the Quincy College criminal justice bachelor’s degree program are not available at this time. To see if the school offers distance learning options in other areas, visit the Quincy College Online Learning page.
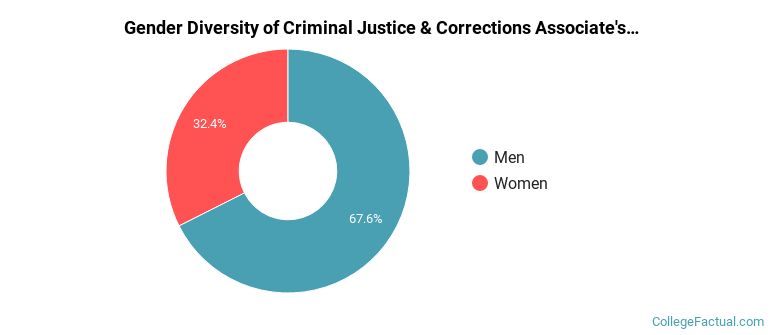
Of the 37 students who graduated with a Associate’s in criminal justice from Quincy College in 2022, 68% were men and 32% were women.
The majority of the students with this major are white. About 54% of 2022 graduates were in this category.
The following table and chart show the ethnic background for students who recently graduated from Quincy College with a associate's in criminal justice.
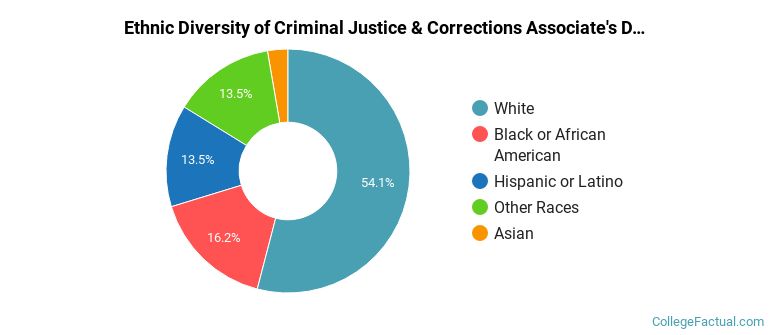
| Ethnic Background | Number of Students |
|---|---|
| Asian | 1 |
| Black or African American | 6 |
| Hispanic or Latino | 5 |
| White | 20 |
| Non-Resident Aliens | 0 |
| Other Races | 5 |