Here is an overview of this program at Saint Joseph’s University - Philadelphia. You can study it at the Bachelor’s level, with graduate study also available. Jump to any of the following sections:
By College Factual’s measure, Saint Joseph’s University - Philadelphia highly for special education, coming in at #87 out of 463 schools nationally.Ranking Rank Best Special Education Schools 87 of 463 Best Special Education Schools in Pennsylvania 8 of 31 Best Special Education Schools in the Middle Atlantic Region 32 of 102
Here is each degree level available for special education at Saint Joseph’s University - Philadelphia, along with how many graduates complete each level annually.Degree Level Annual Graduates Bachelor’s 20 Master’s 56 Graduate Certificate 6 Professional Certificate 1
In the most recent year for which we have data, Saint Joseph’s University - Philadelphia awarded 20 bachelor’s degrees in special education.
Saint Joseph’s University - Philadelphia is not currently ranked for special education at the bachelor’s level.
Special Education graduates with a bachelor’s degree from Saint Joseph’s University - Philadelphia report a median salary of $62,340 a year. This is lower than $81,511, the median for all majors at Saint Joseph’s University - Philadelphia.
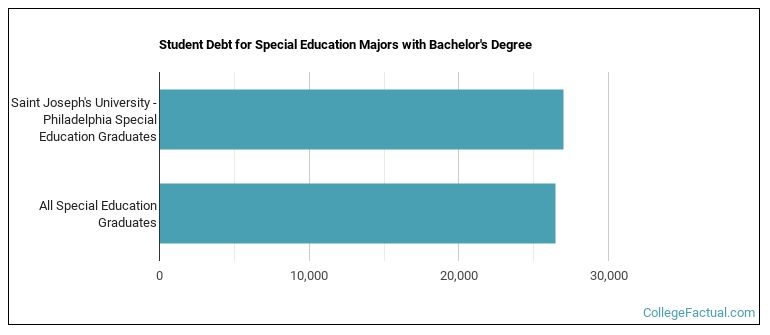
Earning a bachelor’s degree at Saint Joseph’s University - Philadelphia, special education students accumulate a median of $27,000 in student loans. This is higher than $26,426, the typical median for all majors at Saint Joseph’s University - Philadelphia.
The full-time undergraduate tuition and fees are shown below.In State Out of State Tuition $47,740 $53,060 Fees $200 $200
Learn more about Saint Joseph’s University - Philadelphia tuition and fees.
All of the 20 students who graduated with a bachelor’s degree in special education from Saint Joseph’s University - Philadelphia were women.
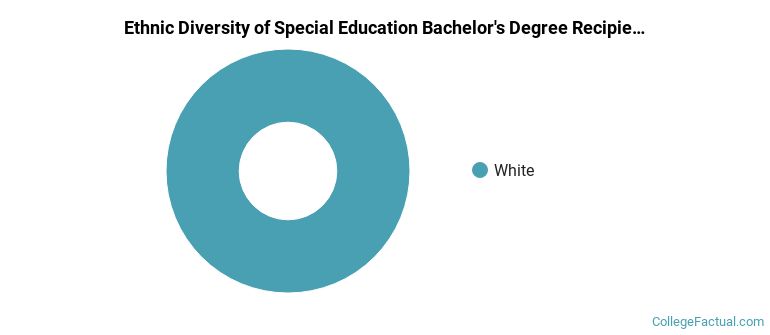
 The largest share of special education bachelor’s degree graduates at Saint Joseph’s University - Philadelphia were White. About 100% of graduates fell into this category.
The following table and chart show the ethnic background for students who recently graduated from Saint Joseph’s University - Philadelphia with a bachelor’s in special education.
| Ethnic Background | Number of Students |
|---|---|
| Asian | 0 |
| Black or African American | 0 |
| Hispanic or Latino | 0 |
| White | 20 |
| Non-Resident Aliens | 0 |
| Other Races | 0 |
Saint Joseph’s University - Philadelphia awarded 20 bachelor’s completions in special education and teaching, general in the most recent reporting year — 100% to women and 0% to men. Most of these graduates identified as White (100%).
This program is also offered at the graduate level at Saint Joseph’s University - Philadelphia. Here are the graduate award levels offered.
