Get the facts about Sam Houston State University. Learn how it ranks, what majors it offers, how diverse it is, and much more.

College Factual recognizes the best colleges and universities in its annual rankings. These rankings include categories for best overall colleges, best colleges for each major, best value schools, and much more.
Sam Houston State University was awarded 252 badges in the 2026 rankings.
College Factual ranked SHSU as #715 out of 3,449 colleges and universities in the country on its 2026 Best Colleges list.
Within the state, SHSU holds the #31 spot on the Best Colleges in Texas ranking.
With an acceptance rate of 90%, Sam Houston State University is easier to get into than many other schools. But that doesn’t mean you can slack off on your application. Make sure to treat this school like any other when submitting requested materials and documents.
About 52% of students accepted to SHSU submitted their SAT scores. When looking at the 25th through the 75th percentile, SAT Evidence-Based Reading and Writing scores ranged between 480 and 570. Math scores were between 450 and 550.
SHSU received ACT scores from 6% of accepted students. When looking at the 25th through the 75th percentile, ACT Composite scores ranged between 17 and 24.
At Sam Houston State University, the student to faculty ratio is 19 to 1. Compared to the national average of 15 to 1, this is somewhat high. This could mean that class sizes may be larger than they are at other colleges or universities or that professors may be required to teach more classes.
Another measure that is often used to estimate how much access students will have to their professors is how many faculty members are full-time. The idea here is that part-time faculty tend to spend less time on campus, so they may not be as available to students as full-timers.
The full-time faculty percentage at Sam Houston State University is 80%. This is higher than the national average of 47%.
Sam Houston State University has a freshmen retention rate of 75%. That’s a good sign that full-time students like the school and their professors enough to want to stick around for another year. It’s also a sign that the admissions team did a good job in choosing applicants who were a good fit for the school.
The on-time graduation rate for someone pursuing a bachelor’s degree is typically four years. This rate at SHSU for first-time, full-time students is 55%, which is better than the national average of 33.3%.
Find out more about the retention and graduation rates at Sam Houston State University.
In the current academic year, there are 18,138 undergraduates at SHSU.
Get more detailed information on the diversity at Sam Houston State University.
The average net price of SHSU is $16,772. The affordability of the school largely depends on your financial need since net price varies by income group. See the table below for the net price for different income groups.### Net Price by Income Group for SHSU$0-30 K $30K-48K $48-75 $75-110K $110K + $11,736 $12,541 $15,419 $21,551 $23,198
The net price is calculated by adding tuition, room, board and other costs and subtracting financial aid. Note that the net price is typically less than the published price for a school. For more information on the sticker price of SHSU, see our tuition and fees and room and board pages.
While almost two-thirds of students nationwide take out loans to pay for college, the percentage may be quite different for the school you plan on attending. At SHSU, approximately 46% of students took out student loans averaging $6,769 a year. That adds up to $27,076 over four years for those students. The student loan default rate is 8.3%. Although this is lower than the national default rate of 10.1%, you’ll still want to keep this in mind when taking out student loans. Get more details about paying for Sam Houston State University.
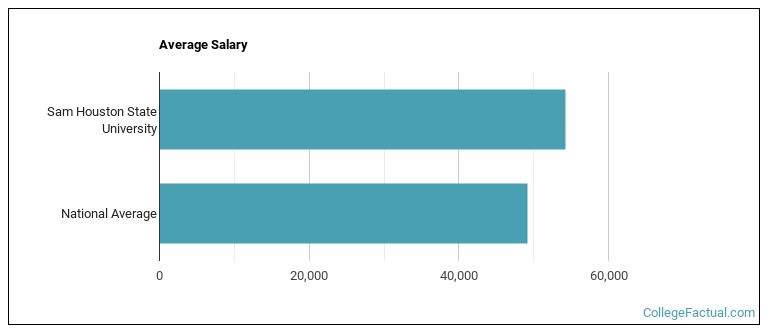
Although some majors pay more than others, students who graduate from Sam Houston State University with a bachelor’s degree go on to jobs where they make an average salary of $54,211 in their early years. That’s great news for Sam Houston State University students since it is 10% more than the average college graduate’s salary of $49,219 per year.
See which majors at Sam Houston State University make the most money.
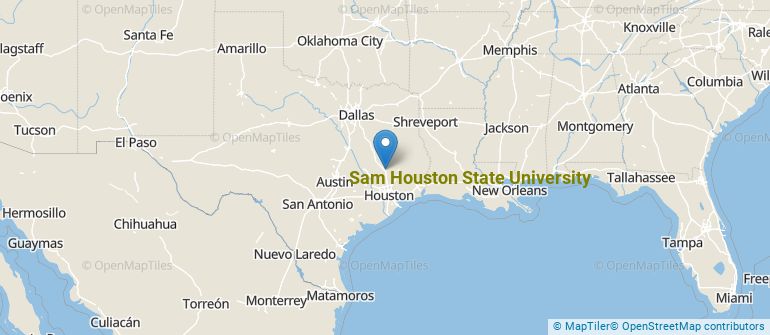
Sam Houston State University is an public institution situated in Huntsville, Texas. Huntsville is a good match for students who enjoy small-town life. Get more details about the location of Sam Houston State University.
Get in touch with Sam Houston State University are given below.Contact Details Address: 1806 Ave J, Huntsville, TX 77340 Phone: 9362941111 Website: www.shsu.edu/ Facebook: www.facebook.com/samhoustonstate Twitter: twitter.com/samhoustonstate
In the most recent reporting year, students from 27 majors graduated from Sam Houston State University. The following table lists the most popular undergraduate majors along with the average salary graduates from those majors make.Most Popular Majors Completions Average Salary of Graduates Multi-Disciplinary Studies 5,278 NA Criminal Justice & Corrections 931 $36,074 General Psychology 349 $27,958 Teacher Education Grade Specific 322 NA Business & Commerce 252 $39,919 Business Administration & Management 202 $61,777 Communication & Media Studies 200 $33,305 Health & Physical Education 171 $35,713 General Biology 158 $32,198 Nursing 147 $67,097
Online courses are a great option for busy, working students as well as for those who have scheduling conflicts and want to study on their own time. As time goes by, expect to see more and more online learning options become available.
11,816 students took at least one online class at Sam Houston State University.
Learn more about online learning at Sam Houston State University.
Footnotes
*The racial-ethnic minorities count is calculated by taking the total number of students and subtracting white students, international students, and students whose race/ethnicity was unknown. This number is then divided by the total number of students at the school to obtain the racial-ethnic minorities percentage.
References