Here is an overview of this program at Smith College. Degrees are awarded at the Bachelor’s level. At its best it places at #6 out of 7 schools (Bachelor’s level) by College Factual. Jump to any of the following sections:
College Factual rates Smith College highly for ethnic studies, placing at #63 out of 124 schools nationally.Ranking Rank Best Ethnic Studies Schools 63 of 124 Best Ethnic Studies Schools in Massachusetts 6 of 7 Best Ethnic Studies Schools in the New England Region 9 of 12
The following degree levels are granted in ethnic studies at Smith College, along with how many graduates complete each level annually.Degree Level Annual Graduates Bachelor’s 27
For the most recent IPEDS reporting year, Smith College awarded 27 bachelor’s degrees in ethnic studies.
Smith College ranks competitively among schools offering ethnic studies at the bachelor’s level. In particular it placed #6 out of 7 schools by College Factual.
Ethnic Studies students who finish a bachelor’s at Smith College earn a median of $42,607 a year. This is lower than $50,277, the median for all majors at Smith College.
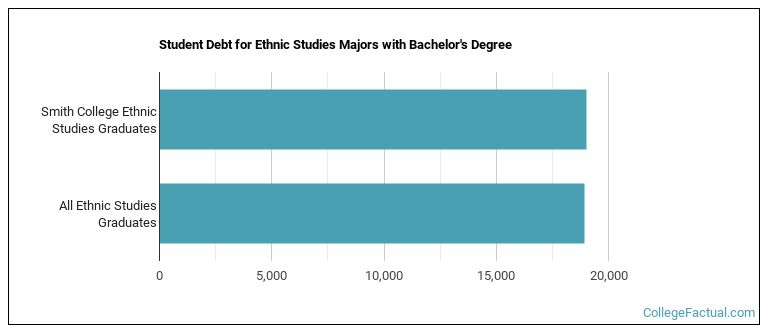
While getting their bachelor’s degree at Smith College, ethnic studies graduates take on a median debt of $19,000 in student loans. This is above $18,941, the typical median for all majors at Smith College.
Information about average full-time undergraduate tuition and fees is shown in the table below.In State Out of State Tuition $55,830 $64,870 Fees $308 $308
Read more about Smith College tuition and fees.
Every one of the 27 students who graduated with a bachelor’s degree in ethnic studies from Smith College identified as women.
 The majority of ethnic studies bachelor’s degree graduates at Smith College are White. Roughly 33% of graduates fell into this category.
The following table and chart show the ethnic background for students who recently graduated from Smith College with a bachelor’s in ethnic studies.
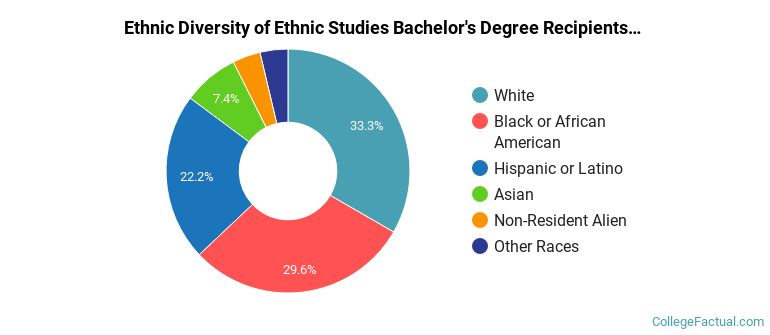
| Ethnic Background | Number of Students |
|---|---|
| Asian | 2 |
| Black or African American | 8 |
| Hispanic or Latino | 6 |
| White | 9 |
| Non-Resident Aliens | 1 |
| Other Races | 1 |
Smith College awarded 19 bachelor’s completions in women’s studies in the most recent reporting year — 100% to women and 0% to men. The largest share of these graduates were White (47%).
Smith College conferred 8 bachelor’s degrees in african-american/black studies in the latest year of data — 100% to women and 0% to men. The largest share of these graduates were Black or African American (62%).
