Below are the key facts about this program at St. John’s University-New York. You can study it at the Bachelor’s level. It ranks as high as #4 out of 5 schools (Bachelor’s level) by College Factual. Jump to any of the following sections:
College Factual rates St. John’s University-New York among the top schools in the country for non-professional legal studies, placing at #44 out of 75 schools nationally.
The following degree levels are granted in non-professional legal studies at St. John’s University-New York, along with how many graduates complete each level annually.Degree Level Annual Graduates Bachelor’s 89
For the most recent IPEDS reporting year, St. John’s University-New York conferred 89 bachelor’s degrees in non-professional legal studies.
St. John’s University-New York is among the very best schools in the country for non-professional legal studies at the bachelor’s level. Specifically, it ranked #4 out of 5 schools by College Factual.
Non-Professional Legal Studies graduates with a bachelor’s degree from St. John’s University-New York go on to jobs where they make a median salary of $52,299 a year. This is below $76,054, the median for all majors at St. John’s University-New York.
To complete a bachelor’s at St. John’s University-New York, non-professional legal studies students borrow a median amount of $26,030 in student loans. This is higher than $25,521, the typical median for all majors at St. John’s University-New York.

The full-time undergraduate tuition and fees are shown below.In State Out of State Tuition $44,450 $51,919 Fees $1,610 $1,610
Find out more about St. John’s University-New York tuition and fees.
For the most recent academic year available, 25% of non-professional legal studies bachelor’s degrees went to men and 75% went to women.
 The largest share of non-professional legal studies bachelor’s degree graduates at St. John’s University-New York were White. Roughly 38% of graduates fell into this category.
The following table and chart show the ethnic background for students who recently graduated from St. John’s University-New York with a bachelor’s in non-professional legal studies.
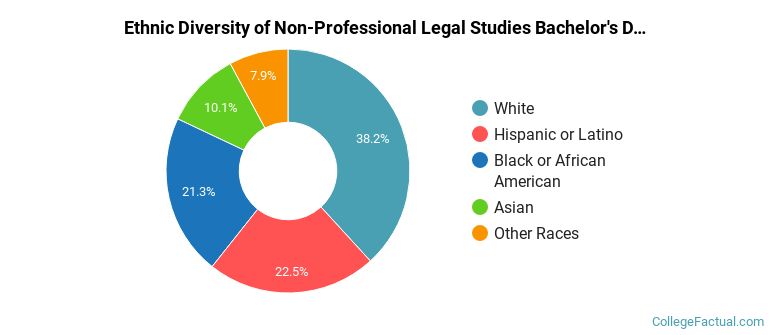
| Ethnic Background | Number of Students |
|---|---|
| Asian | 9 |
| Black or African American | 19 |
| Hispanic or Latino | 20 |
| White | 34 |
| Non-Resident Aliens | 0 |
| Other Races | 7 |
