We've gathered data and other essential information about the program, such as the ethnicity of students, how many students graduated in recent times, and more. We've also included details on how STJ ranks compared to other colleges offering a major in liberal arts.
Jump to any of the following sections:
The bachelor's program at STJ was ranked #760 on College Factual's Best Schools for liberal arts list. It is also ranked #47 in New York.
During the 2021-2022 academic year, St John's University - New York handed out 6 bachelor's degrees in liberal arts general studies. This is a decrease of 54% over the previous year when 13 degrees were handed out.
In 2022, 11 students received their master’s degree in liberal arts from STJ. This makes it the #45 most popular school for liberal arts master’s degree candidates in the country.
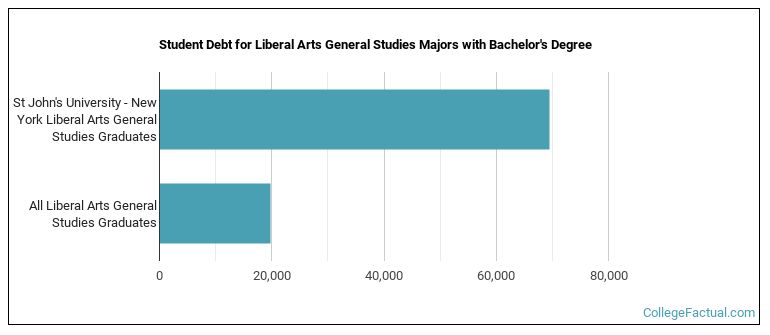
While getting their bachelor's degree at STJ, liberal arts students borrow a median amount of $69,553 in student loans. This is higher than the the typical median of $19,782 for all liberal arts majors across the country.
Learn about other programs related to Liberal Arts General Studies that might interest you.
Maximize your transfer credits and complete your bachelor's degree faster with this flexible online bachelor's from Southern New Hampshire University.
Part-time undergraduates at STJ paid an average of $1,642 per credit hour in 2022-2023. This tuition was the same for both in-state and out-of-state students.
The average full-time tuition and fees for undergraduates are shown in the table below.In State Out of State Tuition $48,301 $48,301 Fees $1,610 $1,610 Books and Supplies $775 $775 On Campus Room and Board $19,926 $19,926 On Campus Other Expenses $2,976 $2,976
Learn more about STJ tuition and fees.
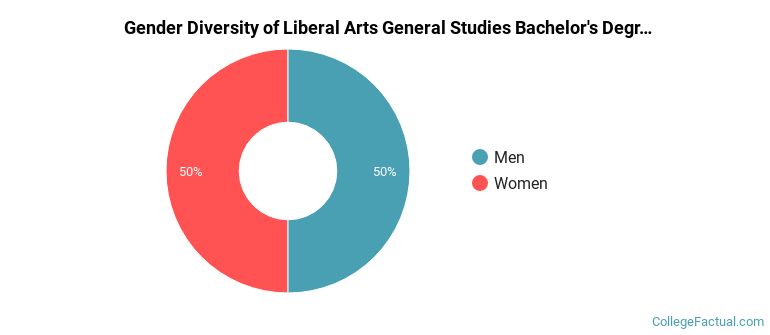
In the 2021-2022 academic year, 6 students earned a bachelor's degree in liberal arts from STJ. About 50% of these graduates were women and the other 50% were men.
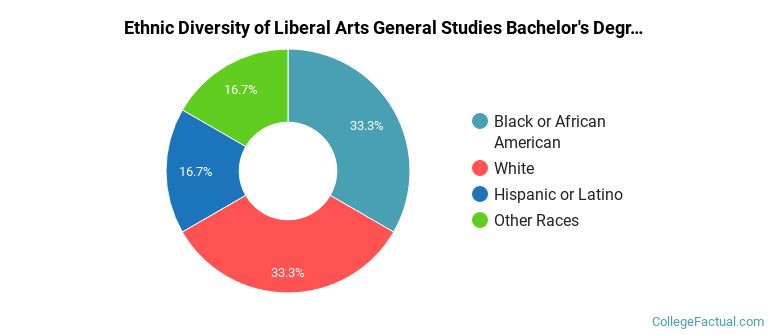
The following table and chart show the ethnic background for students who recently graduated from St John's University - New York with a bachelor's in liberal arts.
| Ethnic Background | Number of Students |
|---|---|
| Asian | 0 |
| Black or African American | 2 |
| Hispanic or Latino | 1 |
| White | 2 |
| Non-Resident Aliens | 0 |
| Other Races | 1 |
Online degrees for the STJ liberal arts bachelor’s degree program are not available at this time. To see if the school offers distance learning options in other areas, visit the STJ Online Learning page.
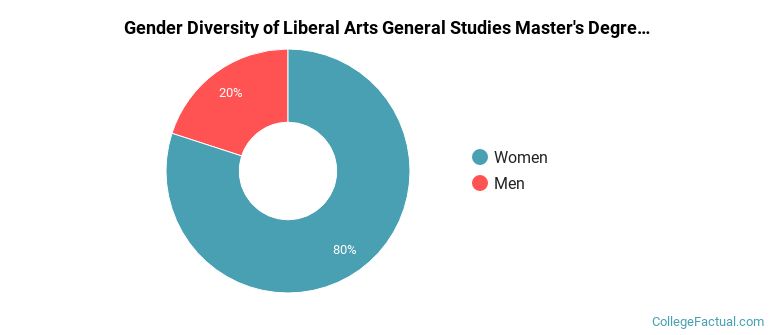
Of the 5 students who graduated with a Master’s in liberal arts from STJ in 2022, 20% were men and 80% were women.
The following table and chart show the ethnic background for students who recently graduated from St John's University - New York with a master's in liberal arts.
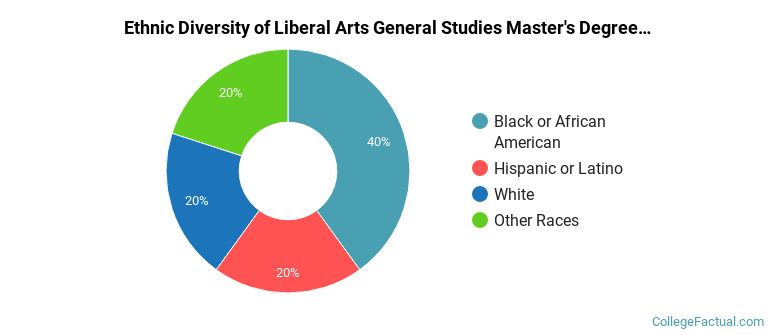
| Ethnic Background | Number of Students |
|---|---|
| Asian | 0 |
| Black or African American | 2 |
| Hispanic or Latino | 1 |
| White | 1 |
| Non-Resident Aliens | 0 |
| Other Races | 1 |
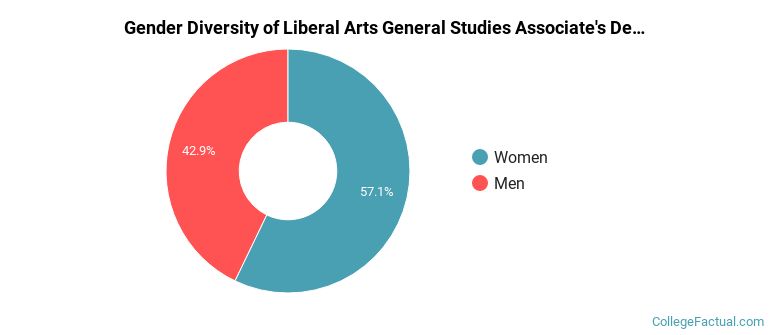
The liberal arts program at STJ awarded 7 associate's degrees in 2021-2022. About 43% of these degrees went to men with the other 57% going to women.
The following table and chart show the ethnic background for students who recently graduated from St John's University - New York with a associate's in liberal arts.
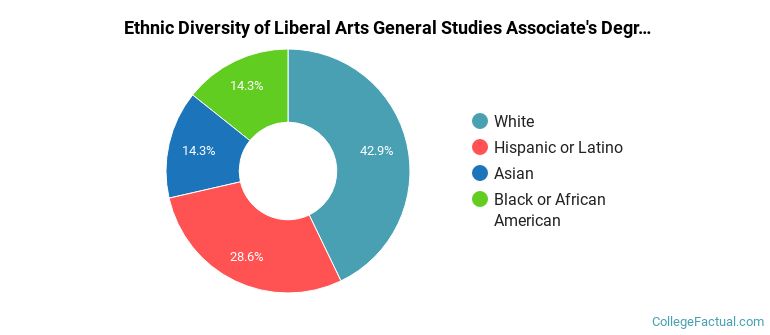
| Ethnic Background | Number of Students |
|---|---|
| Asian | 1 |
| Black or African American | 1 |
| Hispanic or Latino | 2 |
| White | 3 |
| Non-Resident Aliens | 0 |
| Other Races | 0 |
Take a look at the following statistics related to the make-up of the liberal arts majors at St John’s University - New York.
More about our data sources and methodologies.
