We've pulled together some essential information you should know about the program, including how many students graduate each year, the ethnic diversity of these students, and more. In addition, we cover how Tunxis Community College ranks in comparison to other schools with political science programs.
Go directly to any of the following sections:
Learn about start dates, transferring credits, availability of financial aid, and more by contacting the universities below.
Gain a solid understanding of American political history, the current political landscape, and the major political parties with this online bachelor's from Southern New Hampshire University.
The political science major at Tunxis Community College is not ranked on College Factual’s Best Colleges and Universities for Political Science & Government. This could be for a number of reasons, such as not having enough data on the major or school to make an accurate assessment of its quality.
Online degrees for the Tunxis Community College political science bachelor’s degree program are not available at this time. To see if the school offers distance learning options in other areas, visit the Tunxis Community College Online Learning page.
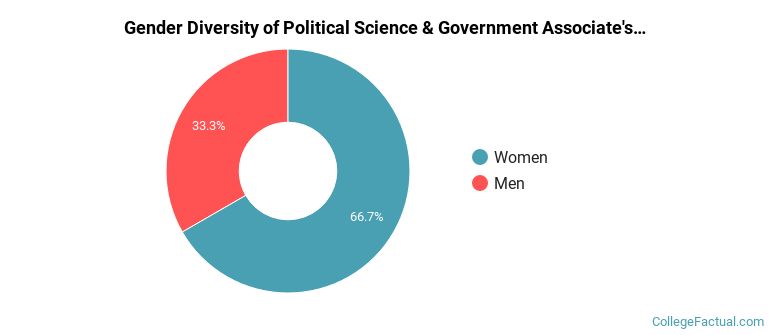
All of the 1 students who graduated with a Associate’s in political science from Tunxis Community College in 2022 were men.
The majority of the associate's degree graduates for this major are black or African Americans. About 100% of grads fell into this category.
The following table and chart show the ethnic background for students who recently graduated from Tunxis Community College with a associate's in political science.
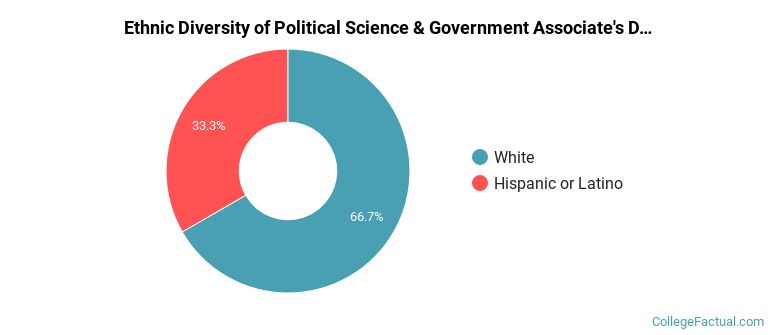
| Ethnic Background | Number of Students |
|---|---|
| Asian | 0 |
| Black or African American | 1 |
| Hispanic or Latino | 0 |
| White | 0 |
| Non-Resident Aliens | 0 |
| Other Races | 0 |
| Related Major | Annual Graduates |
|---|---|
| Sociology | 4 |
