How many UC first-year students return for their second year, and how many go on to graduate? Retention and graduation rates help you understand how students progress at UC. First year retention shows who comes back, and graduation rates show who finishes and how long it takes.
The freshmen retention rate applies to first-time / full-time students who come back for their second year.
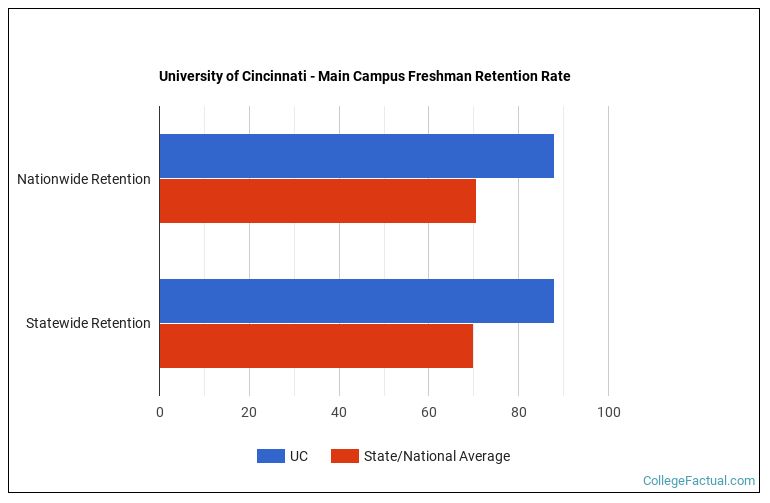
With 85% students making it past their freshmen year, UC has freshmen retention rates above the national average.
Nationwide, the average first to second year retention rate is 70.57%.
When looking at just colleges and universities in Ohio, the average is 69.84%.
| Retention Rate | |
|---|---|
| UC | 85% |
| Nationwide | 70.57% |
| Ohio | 69.84% |
How many of the estimated 5397 students in the class of 2023 actually finished their degree in a timely fashion?
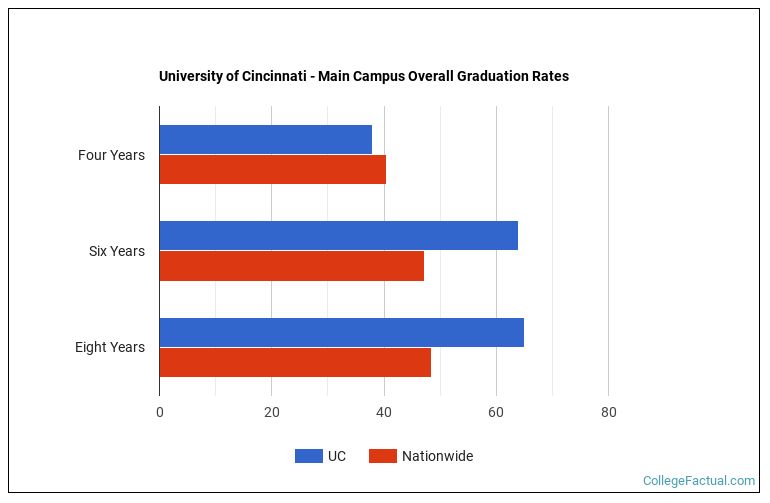
Four years after beginning their degree, 43% of those students had graduated. By 2025, six years after starting their degree, 72% of the students had graduated and after eight years 74% of this class completed their degree.
Any student who completes their bachelor's degree within six years is considered to have graduated on time, according to the National Center for Education Statistics. This makes the offical UC graduation rate 72%.

| Completion Within | Undergraduates | Percentage |
|---|---|---|
| Four Years | 3241 | 43% |
| Six Years | 5397 | 72% |
| Eight Years | 172 | 2% |
| Did Not Complete | 1975 | 26% |
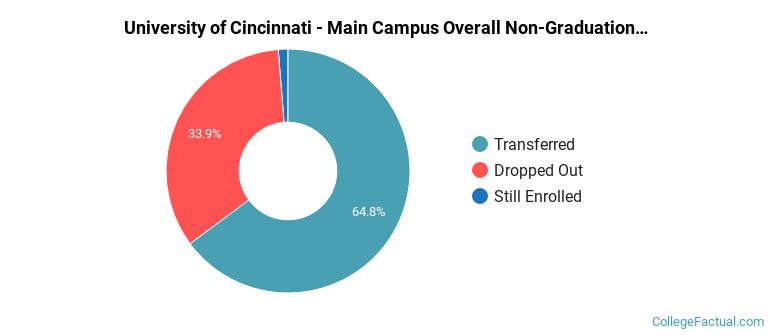
The non-completers rate is anyone who is not still enrolled at the institution after eight years. Both transfer students and drop-outs could be included in this group.
Approximately 1975 students or 26% of the cohort did not complete their degree within eight years.
What happened to the 1975 students who did not complete their degree?
19 are still enrolled.
1139 transferred to another institution.
UC lost contact with the remaining 801 who we assumed dropped out.
| Non-Completions | Undergraduates | Percentage |
|---|---|---|
| Still Enrolled | 19 | 1.0% |
| Transferred | 1139 | 57.7% |
| Dropped Out | 801 | 40.6% |
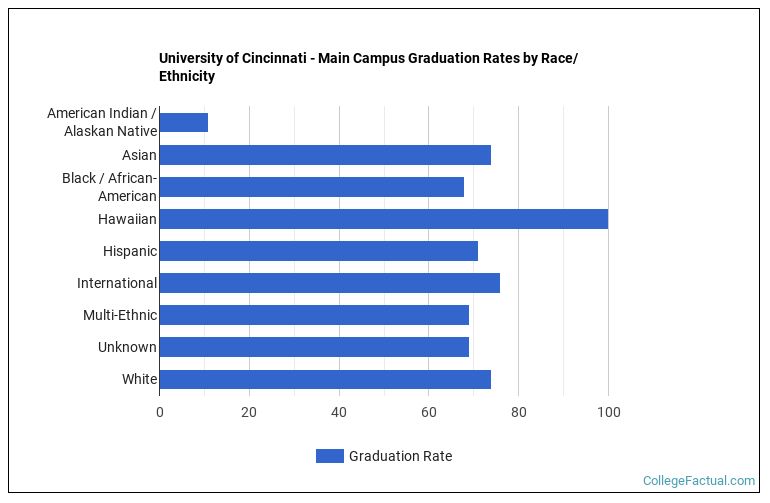
| Race/Ethnicity | Graduation Rate |
|---|---|
| American Indian or Alaskan Native | 80% |
| Asian | 77% |
| Black / African-American | 55% |
| Hawaiian | 40% |
| Hispanic | 75% |
| International | 73% |
| Multi-Ethnic | 68% |
| Unknown | 68% |
| White | 73% |
First-time, full-time students under the age of 25 are much more likely to graduate in four years. Some schools cater to mostly traditional students while others cater to 'non-traditional' students. So called 'non-traditional' students include part-time students or those who may be returning after an absense. It is common for part-time and/or adult students to take longer to graduate.
Traditional Students:
First-time, full-time students under the age of 25.
Non-Traditional Students:
Any student that is not first-time, full-time, and under the age of 25.
The majority of students at UC are considered 'traditional students' who are first-time attending full-time.
Comparing the graduation rates of the specific cohorts below can be more revealing than the overall graduation rates.
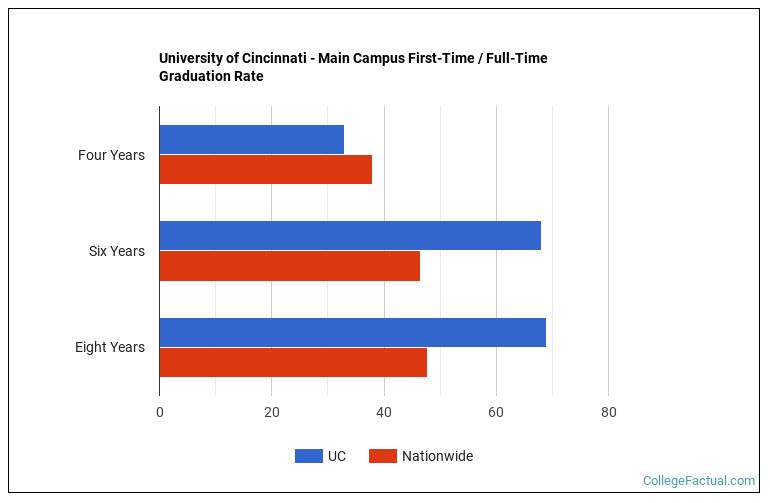
First-time / full-time students at University of Cincinnati-Main Campus represent 66.61% of the students in the class of 2023.
After six years, the UC graduation rate was 72%, and by the eight year mark, 73% of the cohort had completed their degree.
Nationwide, the average graduation rate for this group is 37.92% after four years, 46.43% after six years, and 47.82% after eight years.
| Completions | UC | Nationwide |
|---|---|---|
| Four Years | 38% | 37.92% |
| Six Years | 72% | 46.43% |
| Eight Years | 73% | 47.82% |
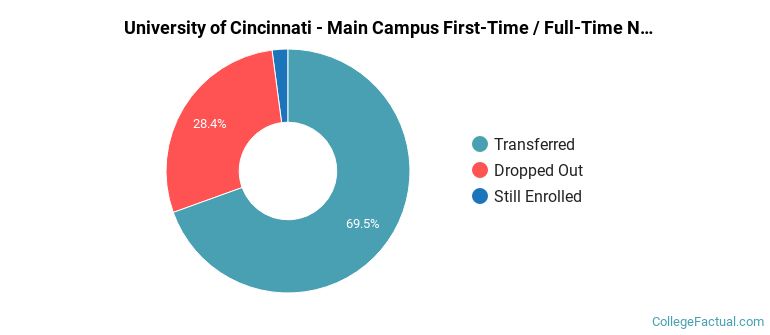
1337 first-time / full-time students or 27% did not complete their degree within eight years.
Of those who did not finish:
22 are still enrolled.
821 transferred to another institution.
UC lost contact with the remaining 494 who we assumed dropped out.
| Non-Completions | Undergraduates | Percentage |
|---|---|---|
| Still Enrolled | 22 | 1.65% |
| Transferred | 821 | 61.41% |
| Dropped Out | 494 | 36.95% |
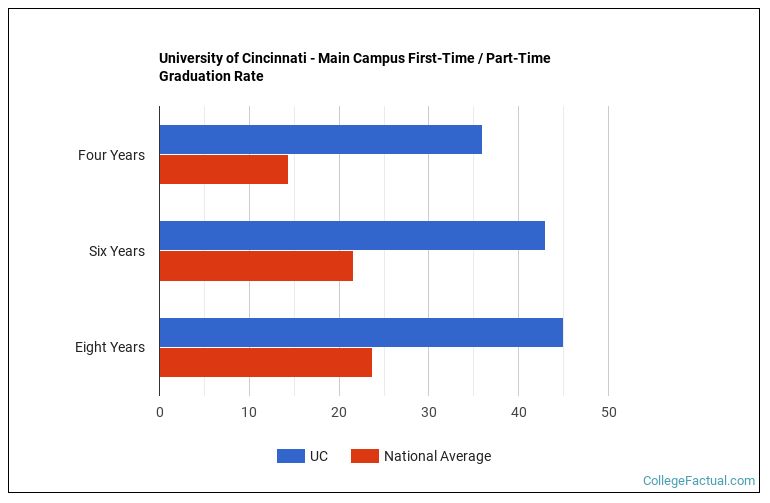
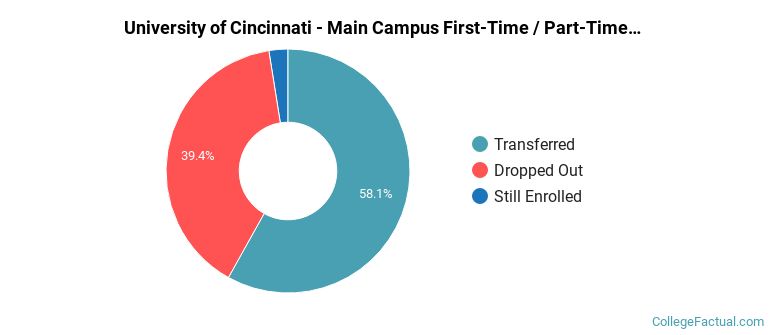
First-time / part-time students at University of Cincinnati-Main Campus represent 0.71% of the students in the class of 2023.
After six years, the UC graduation rate was 44%, and by the eight year mark, 54% of the cohort had completed their degree.
Nationwide, the average graduation rate for this group is 14.37% after four years, 21.59% after six years, and 23.72% after eight years.
| Completions | UC | Nationwide |
|---|---|---|
| Four Years | 24% | 14.37% |
| Six Years | 44% | 21.59% |
| Eight Years | 54% | 23.72% |
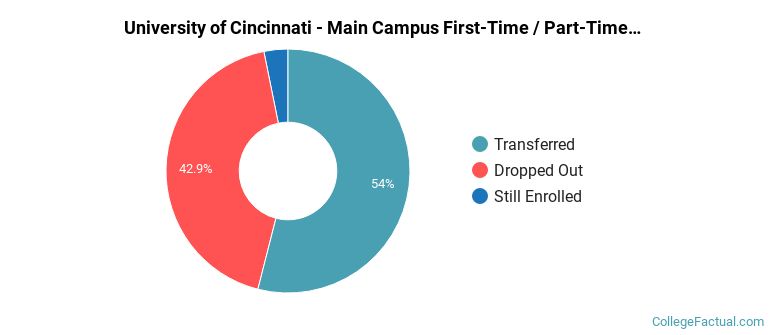
25 first-time / part-time students or 46% did not complete their degree within eight years.
Of those who did not finish:
1 are still enrolled.
11 transferred to another institution.
UC lost contact with the remaining 13 who we assumed dropped out.
| Non-Completions | Undergraduates | Percentage |
|---|---|---|
| Still Enrolled | 1 | 4.00% |
| Transferred | 11 | 44.00% |
| Dropped Out | 13 | 52.00% |
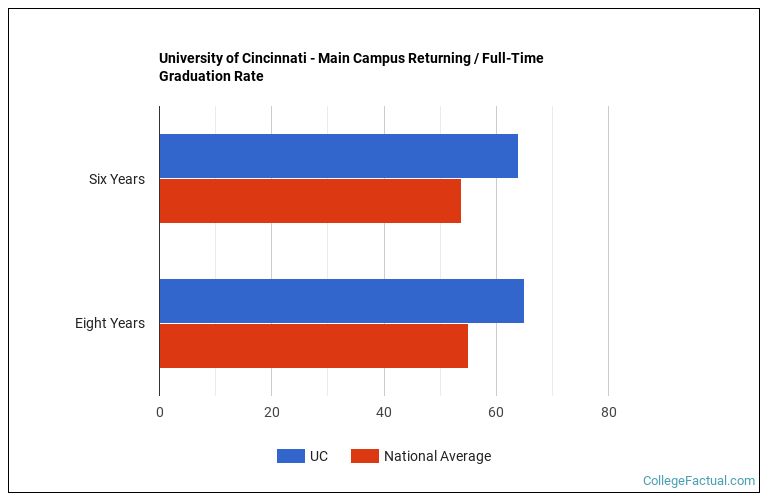
Returning / full-time students at University of Cincinnati-Main Campus represent 21.10% of the students in the class of 2023.
After six years, the UC graduation rate was 77%, and by the eight year mark, 81% of the cohort had completed their degree.
Nationwide, the average graduation rate for this group is 53.83% after six years, and 55.07% after eight years.
| Completions | UC | Nationwide |
|---|---|---|
| Four Years | 0% | 49.57% |
| Six Years | 77% | 53.83% |
| Eight Years | 81% | 55.07% |
303 non first-time / part-time students or 19% did not complete their degree within eight years.
Of those who did not finish:
8 are still enrolled.
164 transferred to another institution.
UC lost contact with the remaining 131 who we assumed dropped out.
| Non-Completions | Undergraduates | Percentage |
|---|---|---|
| Still Enrolled | 8 | 2.64% |
| Transferred | 164 | 54.13% |
| Dropped Out | 131 | 43.23% |
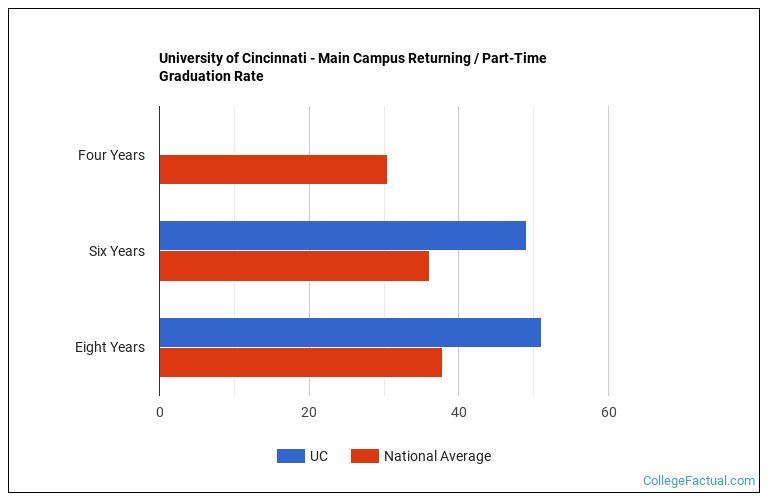
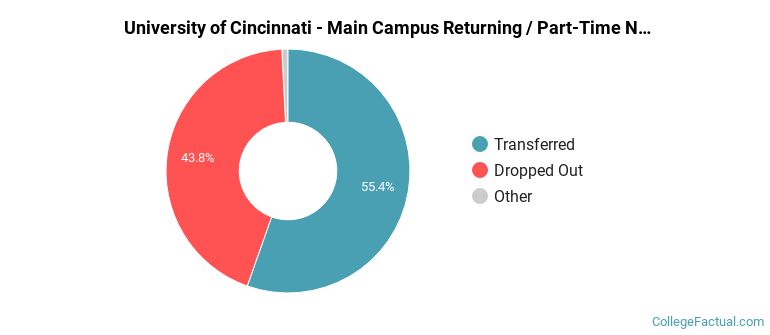
Returning / part-time students at University of Cincinnati-Main Campus represent 11.57% of the students in the class of 2023.
After six years, the UC graduation rate was 61%, and by the eight year mark, 64% of the cohort had completed their degree.
Nationwide, the average graduation rate for this group is 30.46% after four years, 36.03% after six years, and 37.80% after eight years.
| Completions | UC | Nationwide |
|---|---|---|
| Four Years | 53% | 30.46% |
| Six Years | 61% | 36.03% |
| Eight Years | 64% | 37.80% |
310 non first-time / part-time students or 36% did not complete their degree within eight years.
Of those who did not finish:
4 are still enrolled.
143 transferred to another institution.
UC lost contact with the remaining 163 who we assumed dropped out.
| Non-Completions | Undergraduates | Percentage |
|---|---|---|
| Still Enrolled | 4 | 1.29% |
| Transferred | 143 | 46.13% |
| Dropped Out | 163 | 52.58% |
