We’ve pulled together the essential facts you should know about the program at University of Florida. It is offered at the Bachelor’s, Certificate levels. It ranks as high as #2 out of 3 schools (Bachelor’s level) by College Factual. Jump to any of the following sections:
College Factual ranks University of Florida among the top schools in the country for dance, coming in at #34 out of 96 schools nationally.Ranking Rank Best Dance Schools 34 of 96 Best Dance Schools in Florida 2 of 4 Best Dance Schools in the Southeast Region 4 of 22
Here is each degree level offered in dance at University of Florida, along with how many graduates complete each level annually.Degree Level Annual Graduates Bachelor’s 27 Certificate 7
For the most recent IPEDS reporting year, University of Florida handed out 27 bachelor’s degrees in dance.
University of Florida is among the very best schools in the country for dance at the bachelor’s level. Specifically, it ranked #2 out of 3 schools by College Factual.
Dance students who finish a bachelor’s at University of Florida earn a median of $27,822 a year. This is lower than $73,816, the median for all majors at University of Florida.
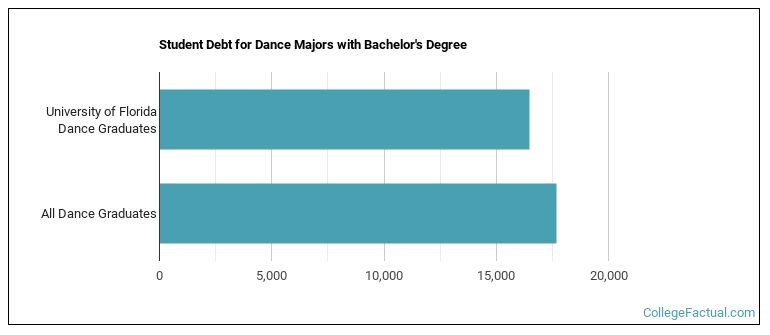
While getting their bachelor’s degree at University of Florida, dance students borrow a median amount of $16,500 in student loans. This is below $17,669, the typical median for all majors at University of Florida.
Information about average full-time undergraduate tuition and fees is shown in the table below.In State Out of State Tuition $4,477 $25,694 Fees $1,904 $2,965
Find out more about University of Florida tuition and fees.
Among recent graduates, 4% of dance bachelor’s degrees went to men and 96% went to women.
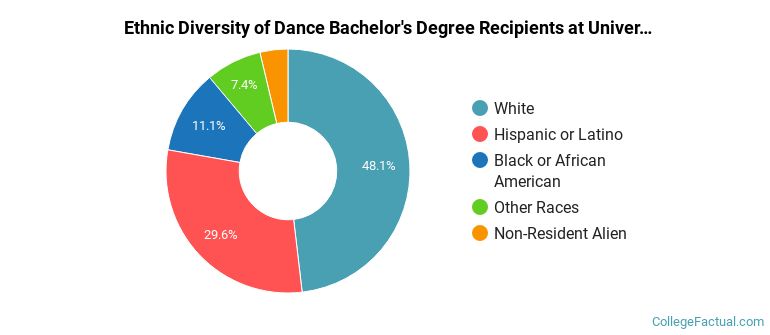
 The majority of dance bachelor’s degree graduates at University of Florida are White. Approximately 48% of graduates fell into this category.
The following table and chart show the ethnic background for students who recently graduated from University of Florida with a bachelor’s in dance.
| Ethnic Background | Number of Students |
|---|---|
| Asian | 0 |
| Black or African American | 3 |
| Hispanic or Latino | 8 |
| White | 13 |
| Non-Resident Aliens | 1 |
| Other Races | 2 |
During the most recent reporting year, University of Florida awarded 7 certificate degrees in dance.
University of Florida is not yet ranked for dance at the certificate level.
In the most recent graduating class, 14% of dance certificate degrees went to men and 86% went to women.
 The majority of dance certificate degree graduates at University of Florida are White. Approximately 43% of graduates fell into this category.
The following table and chart show the ethnic background for students who recently graduated from University of Florida with a certificate in dance.

| Ethnic Background | Number of Students |
|---|---|
| Asian | 1 |
| Black or African American | 0 |
| Hispanic or Latino | 2 |
| White | 3 |
| Non-Resident Aliens | 0 |
| Other Races | 1 |
