Below are the key facts about this program at University of Georgia. You can study it at the Bachelor’s level, with graduate study also available. Its best result is a rank of #1 out of 31 schools (Bachelor’s level) by College Factual. Jump to any of the following sections:
By College Factual’s measure, University of Georgia highly for teacher education grade specific, coming in at #38 out of 1,208 schools nationally.
The following degree levels are available for teacher education grade specific at University of Georgia, along with how many graduates complete each level annually.Degree Level Annual Graduates Bachelor’s 130 Master’s 136 Doctoral 27 Graduate Certificate 8
For the most recent IPEDS reporting year, University of Georgia handed out 130 bachelor’s degrees in teacher education grade specific.
University of Georgia is among the very best schools in the country for teacher education grade specific at the bachelor’s level. Specifically, it ranked #1 out of 31 schools by College Factual.
Teacher Education Grade Specific majors who earn their bachelor’s degree from University of Georgia go on to jobs where they make a median salary of $50,996 a year. This is below $65,444, the median for all majors at University of Georgia.
Earning a bachelor’s degree at University of Georgia, teacher education grade specific graduates take on a median debt of $18,229 in student loans. This is lower than $21,822, the typical median for all majors at University of Georgia.

Information about average full-time undergraduate tuition and fees is shown in the table below.In State Out of State Tuition $9,790 $30,272 Fees $1,416 $1,416
Find out more about University of Georgia tuition and fees.
Among recent graduates, 5% of teacher education grade specific bachelor’s degrees went to men and 95% went to women.
 The majority of teacher education grade specific bachelor’s degree graduates at University of Georgia were White. Roughly 83% of graduates fell into this category.
The following table and chart show the ethnic background for students who recently graduated from University of Georgia with a bachelor’s in teacher education grade specific.
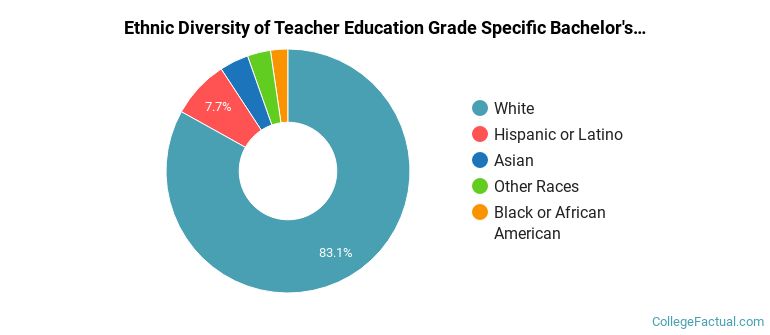
| Ethnic Background | Number of Students |
|---|---|
| Asian | 5 |
| Black or African American | 3 |
| Hispanic or Latino | 10 |
| White | 108 |
| Non-Resident Aliens | 0 |
| Other Races | 4 |
University of Georgia awarded 109 bachelor’s completions in early childhood education and teaching recently — 97% to women and 3% to men. The largest share of these graduates were White (81%).
University of Georgia awarded 21 bachelor’s completions in junior high/intermediate/middle school education and teaching in the latest year of data — 86% to women and 14% to men. The largest share of these graduates were White (95%).
This program is also offered at the graduate level at University of Georgia. Annual graduate completions by level are shown below.
