Below are the key facts about this program at University of Kansas. Degrees are awarded at the Bachelor’s, Certificate levels, with graduate study also available. Jump to any of the following sections:
The following degree levels are available for ethnic studies at University of Kansas, along with how many graduates complete each level annually.Degree Level Annual Graduates Bachelor’s 8 Certificate 4 Master’s 9 Doctoral 2 Graduate Certificate 14
For the most recent IPEDS reporting year, University of Kansas conferred 8 bachelor’s degrees in ethnic studies.
University of Kansas has not been ranked for ethnic studies at the bachelor’s level.
The full-time undergraduate tuition and fees are shown below.In State Out of State Tuition $10,092 $29,298 Fees $1,134 $1,134
Read more about University of Kansas tuition and fees.
For the most recent academic year available, 12% of ethnic studies bachelor’s degrees went to men and 88% went to women.
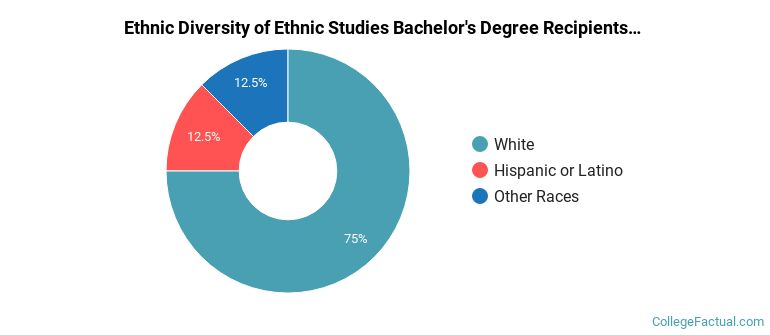
 The largest share of ethnic studies bachelor’s degree graduates at University of Kansas are White. About 75% of graduates fell into this category.
The following table and chart show the ethnic background for students who recently graduated from University of Kansas with a bachelor’s in ethnic studies.
| Ethnic Background | Number of Students |
|---|---|
| Asian | 0 |
| Black or African American | 0 |
| Hispanic or Latino | 1 |
| White | 6 |
| Non-Resident Aliens | 0 |
| Other Races | 1 |
University of Kansas awarded 8 bachelor’s completions in women’s studies recently — 88% to women and 12% to men. Most of these graduates identified as White (75%).
In the most recent year for which we have data, University of Kansas handed out 4 certificate degrees in ethnic studies.
University of Kansas is not currently ranked for ethnic studies at the certificate level.
In the most recent graduating class, 50% of ethnic studies certificate degrees went to men and 50% went to women.
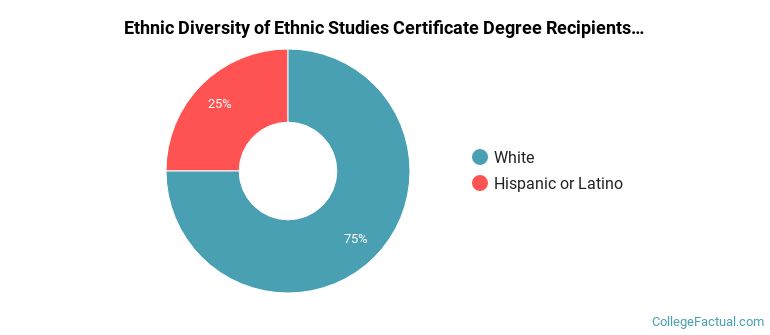
 The majority of ethnic studies certificate degree graduates at University of Kansas were White. Roughly 75% of graduates fell into this category.
The following table and chart show the ethnic background for students who recently graduated from University of Kansas with a certificate in ethnic studies.
| Ethnic Background | Number of Students |
|---|---|
| Asian | 0 |
| Black or African American | 0 |
| Hispanic or Latino | 1 |
| White | 3 |
| Non-Resident Aliens | 0 |
| Other Races | 0 |
University of Kansas awarded 4 certificate completions in women’s studies in the latest year of data — 50% to women and 50% to men. Most of these graduates identified as White (75%).
This program is also offered at the graduate level at University of Kansas. Annual graduate completions by level are shown below.Graduate Level Annual Graduates Master’s Degrees in Ethnic Studies 9 Doctoral Degrees in Ethnic Studies 2 Graduate Certificate Degrees in Ethnic Studies 14