Below are the key facts about this program at University of Maine. It is offered at the Bachelor’s, Certificate levels, with graduate study also available. At its best it places at #4 out of 5 schools (Bachelor’s level) by College Factual. Jump to any of the following sections:
By College Factual’s measure, University of Maine as a strong choice for fine & studio arts, coming in at #429 out of 664 schools nationally.Ranking Rank Best Fine & Studio Arts Schools 429 of 664 Best Fine & Studio Arts Schools in Maine 4 of 5 Best Fine & Studio Arts Schools in the New England Region 43 of 56
The table below lists every degree level granted in fine & studio arts at University of Maine, along with how many graduates complete each level annually.Degree Level Annual Graduates Bachelor’s 25 Certificate 1 Master’s 3
In the most recent year for which we have data, University of Maine handed out 25 bachelor’s degrees in fine & studio arts.
University of Maine ranks competitively among schools offering fine & studio arts at the bachelor’s level. Specifically, it ranked #4 out of 5 schools by College Factual.
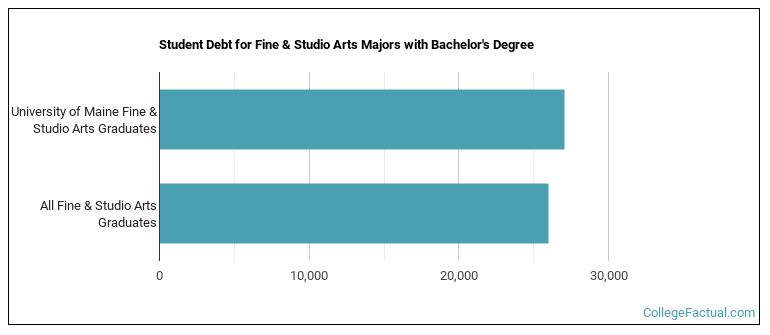
While getting their bachelor’s degree at University of Maine, fine & studio arts students borrow a median amount of $27,050 in student loans. This is above $25,984, the typical median for all majors at University of Maine.
Information about average full-time undergraduate tuition and fees is shown in the table below.In State Out of State Tuition $11,640 $35,790 Fees $966 $966
Find out more about University of Maine tuition and fees.
For the most recent academic year available, 28% of fine & studio arts bachelor’s degrees went to men and 72% went to women.
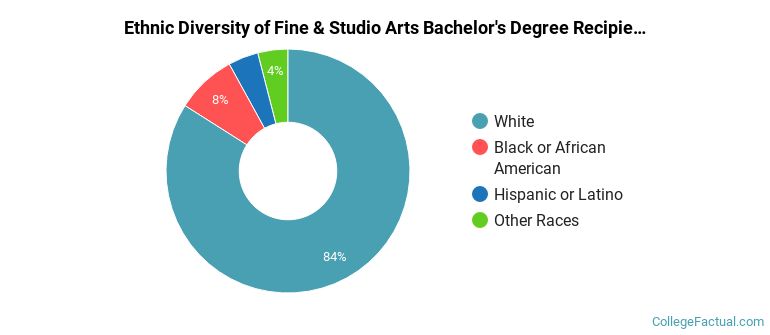
 The majority of fine & studio arts bachelor’s degree graduates at University of Maine are White. Roughly 84% of graduates fell into this category.
The following table and chart show the ethnic background for students who recently graduated from University of Maine with a bachelor’s in fine & studio arts.
| Ethnic Background | Number of Students |
|---|---|
| Asian | 0 |
| Black or African American | 2 |
| Hispanic or Latino | 1 |
| White | 21 |
| Non-Resident Aliens | 0 |
| Other Races | 1 |
University of Maine granted 15 bachelor’s degrees in fine/studio arts, general recently — 73% to women and 27% to men. The largest share of these graduates were White (80%).
University of Maine awarded 9 bachelor’s degrees in fine arts and art studies, other recently — 78% to women and 22% to men. The largest share of these graduates were White (89%).
University of Maine awarded 1 bachelor’s completion in art history, criticism and conservation in the latest year of data — 0% to women and 100% to men. The most common background among these graduates was White (100%).
During the most recent reporting year, University of Maine awarded 1 certificate degree in fine & studio arts.
University of Maine is not yet ranked for fine & studio arts at the certificate level.
All of the 1 student who graduated with a certificate degree in fine & studio arts from University of Maine were women.
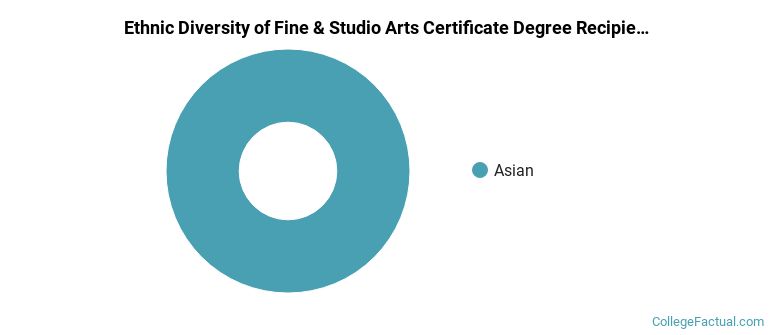
 The majority of fine & studio arts certificate degree graduates at University of Maine are Asian. Approximately 100% of graduates fell into this category.
The following table and chart show the ethnic background for students who recently graduated from University of Maine with a certificate in fine & studio arts.
| Ethnic Background | Number of Students |
|---|---|
| Asian | 1 |
| Black or African American | 0 |
| Hispanic or Latino | 0 |
| White | 0 |
| Non-Resident Aliens | 0 |
| Other Races | 0 |
University of Maine granted 1 certificate completion in fine arts and art studies, other in the latest year of data — 100% to women and 0% to men. The largest share of these graduates were Asian (100%).
Graduate study is also available at University of Maine. Annual graduate completions by level are shown below.Graduate Level Annual Graduates Master’s Degrees in Fine & Studio Arts 3