Below are the key facts about this program at University of Memphis. You can study it at the Bachelor’s level, with graduate study also available. At its best it places at #8 out of 14 schools (Bachelor’s level) by College Factual. Jump to any of the following sections:
College Factual rates University of Memphis as a strong choice for music, ranked #178 out of 416 schools nationally.
| Ranking | Rank |
|---|---|
| Best Music Schools | 178 of 416 |
| Best Music Schools in Tennessee | 9 of 15 |
| Best Music Schools in the Southeast Region | 34 of 98 |
Here is each degree level granted in music at University of Memphis, along with how many graduates complete each level annually.
| Degree Level | Annual Graduates |
|---|---|
| Bachelor’s | 37 |
| Master’s | 13 |
| Doctoral | 19 |
| Graduate Certificate | 5 |
During the most recent reporting year, University of Memphis awarded 37 bachelor’s degrees in music.
University of Memphis is a solid choice among schools offering music at the bachelor’s level. Its best result was #8 out of 14 schools by College Factual.
| Ranking | Rank |
|---|---|
| Best Music Bachelor’s Degree Schools in Tennessee | 8 |
| Best Music Bachelor’s Degree Schools in the Southeast Region | 32 |
| Best Music Bachelor’s Degree Schools | 164 |
Music graduates with a bachelor’s degree from University of Memphis go on to jobs where they make a median salary of $41,074 a year. This is below $55,025, the median for all majors at University of Memphis.
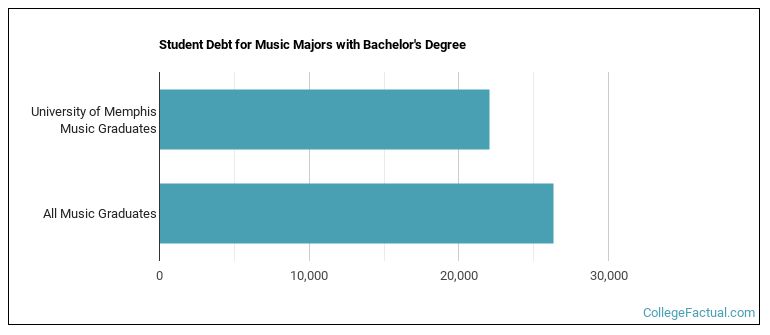
While getting their bachelor’s degree at University of Memphis, music students accumulate a median of $22,060 in student loans. This is lower than $26,315, the typical median for all majors at University of Memphis.
Average full-time tuition and fees are listed in the table below.
| In State | Out of State | |
|---|---|---|
| Tuition | $8,352 | $13,512 |
| Fees | $1,872 | $1,872 |
Find out more about University of Memphis tuition and fees.
For the most recent academic year available, 54% of music bachelor’s degrees went to men and 46% went to women.
 The majority of music bachelor’s degree graduates at University of Memphis were White. Roughly 73% of graduates fell into this category.
The following table and chart show the ethnic background for students who recently graduated from University of Memphis with a bachelor’s in music.

| Ethnic Background | Number of Students |
|---|---|
| Asian | 0 |
| Black or African American | 6 |
| Hispanic or Latino | 3 |
| White | 27 |
| Non-Resident Aliens | 1 |
| Other Races | 0 |
You can also pursue this field at the graduate level at University of Memphis. Annual graduate completions by level are shown below.
| Graduate Level | Annual Graduates |
|---|---|
| Master’s Degrees in Music | 13 |
| Doctoral Degrees in Music | 19 |
| Graduate Certificate Degrees in Music | 5 |
