Get the facts about University of Nevada-Las Vegas. Learn how it ranks, what majors it offers, how diverse it is, and much more.

College Factual recognizes the best colleges and universities in its annual rankings. These rankings include categories for best overall colleges, best colleges for each major, best value schools, and much more.
University of Nevada-Las Vegas was awarded 121 badges in the 2026 rankings.
College Factual ranked UNLV as #773 out of 3,449 colleges and universities in the country on its 2026 Best Colleges list. This puts it in the top 20% of all schools in the nation.
UNLV also holds the #5 spot on the Best Colleges in Nevada ranking.
With an acceptance rate of 96%, University of Nevada-Las Vegas is easier to get into than many other schools. But that doesn’t mean you can slack off on your application. Make sure to treat this school like any other when submitting requested materials and documents.
About 9% of students accepted to UNLV submitted their SAT scores. When looking at the 25th through the 75th percentile, SAT Evidence-Based Reading and Writing scores ranged between 510 and 630. Math scores were between 500 and 610.
UNLV received ACT scores from 65% of accepted students. When looking at the 25th through the 75th percentile, ACT Composite scores ranged between 18 and 25.
At University of Nevada-Las Vegas, the student to faculty ratio is 19 to 1. Compared to the national average of 15 to 1, this is somewhat high. This could mean that class sizes may be larger than they are at other colleges or universities or that professors may be required to teach more classes.
When estimating how much access students will have to their teachers, some people like to look at what percentage of faculty members are full time. This is because part-time teachers may not have as much time to spend on campus as their full-time counterparts.
The full-time faculty percentage at University of Nevada-Las Vegas is 99%. This is higher than the national average of 47%.
University of Nevada-Las Vegas has a freshmen retention rate of 78%. That’s a good sign that full-time students like the school and their professors enough to want to stick around for another year. It’s also a sign that the admissions team did a good job in choosing applicants who were a good fit for the school.
Students are considered to have graduated on time if they finish their studies within four years. At UNLV the on-time graduation rate of first-time, full-time students is 50%. That is great when compared to the national average of 33.3%.
Find out more about the retention and graduation rates at University of Nevada-Las Vegas.
The current enrollment includes 24,131 undergraduates at UNLV.
Get more detailed information on the diversity at University of Nevada-Las Vegas.
The overall average net price of UNLV is $16,772. The affordability of the school largely depends on your financial need since net price varies by income group. See the table below for the net price for different income groups.### Net Price by Income Group for UNLV$0-30 K $30K-48K $48-75 $75-110K $110K + $8,024 $8,679 $10,529 $14,169 $15,555
The net price is calculated by adding tuition, room, board and other costs and subtracting financial aid. Note that the net price is typically less than the published price for a school. For more information on the sticker price of UNLV, see our tuition and fees and room and board pages.
Almost 66% of college students who graduated with the class of 2018 took out student loans, but that percentage varies from school to school. At UNLV, approximately 25% of students took out student loans averaging $8,295 a year. That adds up to $33,180 over four years for those students. The student loan default rate is 6.9%. Although this is lower than the national default rate of 10.1%, you’ll still want to keep this in mind when taking out student loans. Get more details about paying for University of Nevada-Las Vegas.
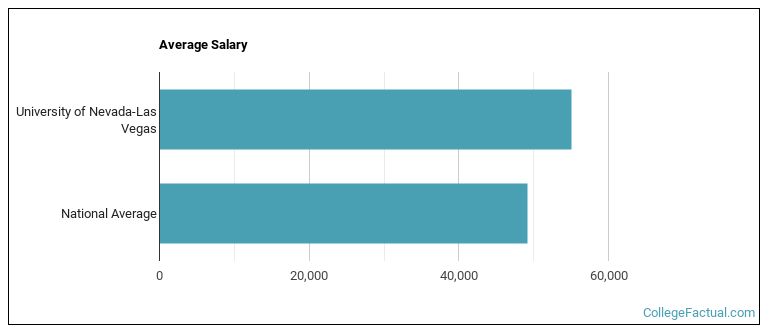
The pay for some majors is higher than others, but on average, students who graduate with a bachelor’s degree from University of Nevada-Las Vegas make about $55,037 a year during their first few years of employment after graduation. This is good news for future University of Nevada-Las Vegas graduates since it is 12% more than the average college graduate’s salary of $49,219 per year.
See which majors at University of Nevada-Las Vegas make the most money.
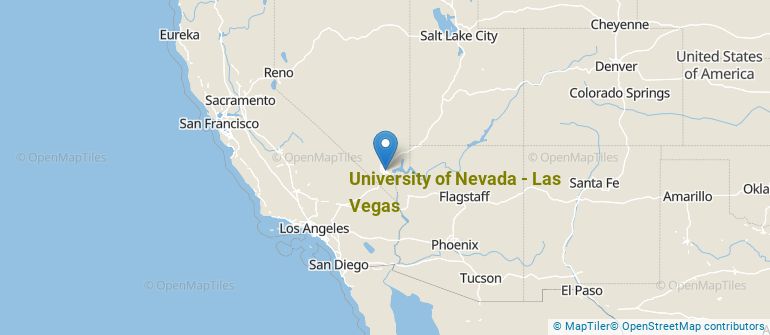
University of Nevada-Las Vegas is an public institution found in Las Vegas, Nevada. The location of the school is great for students who enjoy the amenities of city life. Get more details about the location of University of Nevada-Las Vegas.
Get in touch with University of Nevada-Las Vegas are listed below.Contact Details Address: 4505 S Maryland Pky, Las Vegas, NV 89154 Phone: 7028953011 Website: www.unlv.edu/ Facebook: www.unlv.edu/directories/socialmedia/facebook
In the latest year of available data, students from 26 majors graduated from University of Nevada-Las Vegas. The following table lists the most popular undergraduate majors along with the average salary graduates from those majors make.Most Popular Majors Completions Average Salary of Graduates Multi-Disciplinary Studies 6,945 NA General Psychology 531 $29,390 Hospitality Management 455 $44,625 Teacher Education Grade Specific 422 $46,720 Nursing 316 $80,660 Criminal Justice & Corrections 303 $33,653 Health & Physical Education 263 $26,952 Accounting 253 $52,049 General Biology 235 $21,244 Business Administration & Management 223 $51,422
Online learning is becoming popular at even the oldest colleges and universities in the United States. Not only are online classes great for returning adults with busy schedules, they are also frequented by a growing number of traditional students.
18,202 students took at least one online class at University of Nevada-Las Vegas.
Learn more about online learning at University of Nevada-Las Vegas.
Footnotes
*The racial-ethnic minorities count is calculated by taking the total number of students and subtracting white students, international students, and students whose race/ethnicity was unknown. This number is then divided by the total number of students at the school to obtain the racial-ethnic minorities percentage.
References