Here, you'll find out more about the major, including such details as the number of graduates, what degree levels are offered, ethnicity of students, average salaries, and more. We've also included details on how UNH Manchester ranks compared to other colleges offering a major in psychology.
Go directly to any of the following sections:
The bachelor's program at UNH Manchester was ranked #293 on College Factual's Best Schools for psychology list. It is also ranked #4 in New Hampshire.Ranking Type Rank Best General Psychology Bachelor’s Degree Schools 289 Best General Psychology Schools 293
During the 2021-2022 academic year, University of New Hampshire at Manchester handed out 13 bachelor's degrees in general psychology. This is a decrease of 32% over the previous year when 19 degrees were handed out.
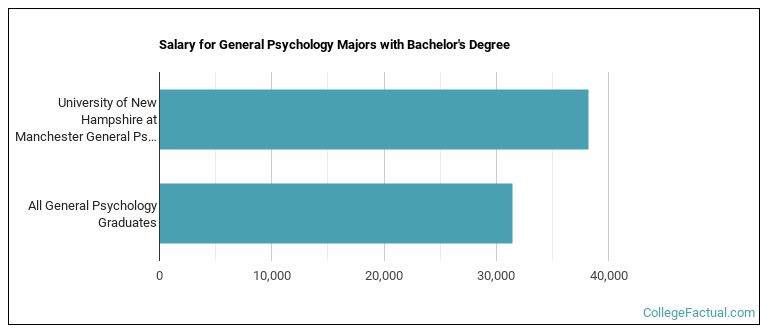
Psychology majors who earn their bachelor's degree from UNH Manchester go on to jobs where they make a median salary of $38,229 a year. This is great news for graduates of the program, since this figure is higher than the national average of $31,484 for all psychology bachelor's degree recipients.
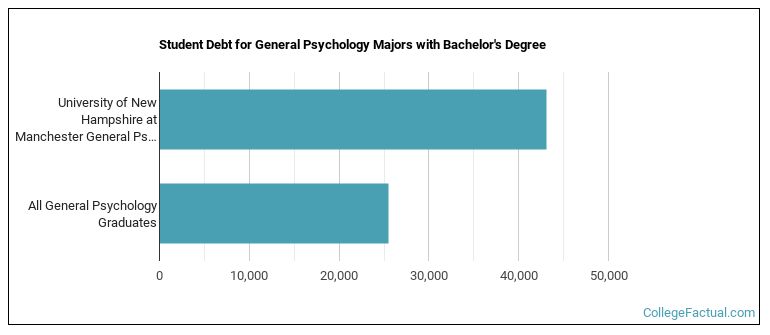
While getting their bachelor's degree at UNH Manchester, psychology students borrow a median amount of $43,106 in student loans. This is higher than the the typical median of $25,532 for all psychology majors across the country.
The typical student loan payment of a bachelor's degree student from the psychology program at UNH Manchester is $376 per month.
In 2022-2023, the average part-time undergraduate tuition at UNH Manchester was $1,450 per credit hour for out-of-state students. The average for in-state students was $630 per credit hour.
The following table shows the average full-time tuition and fees for undergraduates.In State Out of State Tuition $15,150 $34,860 Fees $670 $670 Books and Supplies $1,000 $1,000
Learn more about UNH Manchester tuition and fees.
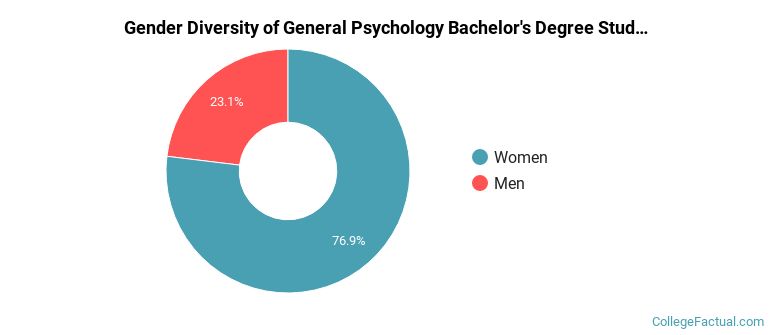
In the 2021-2022 academic year, 13 students earned a bachelor's degree in psychology from UNH Manchester. About 77% of these graduates were women and the other 23% were men.
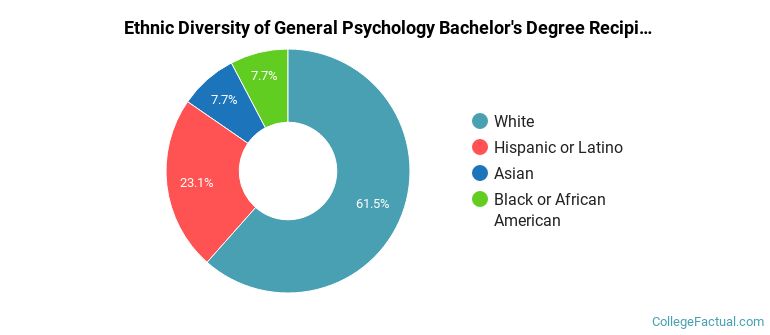
The majority of the students with this major are white. About 62% of 2022 graduates were in this category.
The following table and chart show the ethnic background for students who recently graduated from University of New Hampshire at Manchester with a bachelor's in psychology.
| Ethnic Background | Number of Students |
|---|---|
| Asian | 1 |
| Black or African American | 1 |
| Hispanic or Latino | 3 |
| White | 8 |
| Non-Resident Aliens | 0 |
| Other Races | 0 |
Online degrees for the UNH Manchester psychology bachelor’s degree program are not available at this time. To see if the school offers distance learning options in other areas, visit the UNH Manchester Online Learning page.
Take a look at the following statistics related to the make-up of the psychology majors at University of New Hampshire at Manchester.
More about our data sources and methodologies.