How safe is USF Tampa? Below we’ll take a look at crime statistics for the college campus and surrounding areas.
What you’ll find in our crime and safety report on USF Tampa:
Our crime statistics come from the U.S. Department of Education’s Campus Safety and Security data. The four types of crimes we will be analyzing are violence against women, arrests for major crimes, arrests for possession, and disciplinary actions.
Murder, rape, robbery, aggravated assault, and arson are the types of things included in the arrests for major crimes category. The violence against women grouping includes things such as domestic violence, date rape, and stalking. The arrests for possession classification deals with things such as weapons possession, alcohol violations, and drug violations. The disciplinary actions category involves possession of weapons, alcohol violations, and drug violations in the cases where no arrest occurred but some action was taken.
Many colleges and universities report zero incidents in some or all of these categories. In fact, 56% of the schools we cover reported no arrests for major crimes, 67% reported no violence against women, 70% reported no arrests for possession, and 68% reported no disciplinary actions.
While zero reported crimes may seem like a good sign, it does not necessarily indicate that the school has been safer. It may just be that the school doesn’t have as strict reporting as others. Likewise, a high number of incidents may just mean that the school is stricter about law enforcement and reporting.
University of South Florida reported 491 incidents related to crime and safety in 2024. These student-involved incidents took place at or near campus or on other properties affiliated with the school. That works out to 9.89 incidents per 1,000 students, considering that the student body population is 49,622.
Below, you can see the number of incidents by category.Category Number of Incidents Number of Incidents per 1,000 students Arrests for Major Crimes 205 4.13 Arrests for Possession 229 4.61 Violence Against Women 39 0.79 Disciplinary Actions 18 0.36
The chart below shows what percentage of USF Tampa crime and safety incidents are in each category.
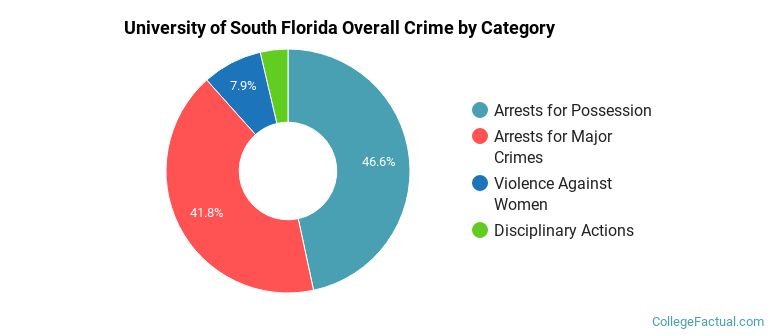
Disciplinary actions account for 3.7% of all crime and safety incidents at the school. Around 46.6% of the crime and safety-related incidents at University of South Florida resulted in arrests for possession. About 41.8% of incidents were arrests for major crimes. Acts of violence against women accounted for 7.9% of incidents.
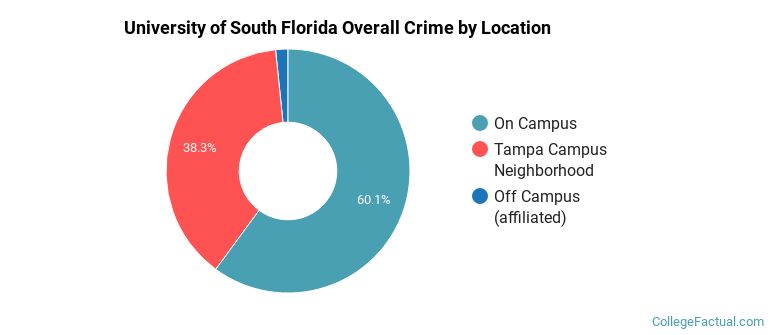
The chart below shows what percentage of USF Tampa crime and safety incidents happened in each location.
In 2024, University of South Florida reported 295 incidents related to crime and safety that involved students on campus. Since the number of students at the school that year was 49,622, that’s 5.94 incidents per 1,000 students.
Below, you can see the number of incidents by category.Category Number of Incidents Number of Incidents per 1,000 students Arrests for Major Crimes 200 4.03 Arrests for Possession 49 0.99 Violence Against Women 30 0.60 Disciplinary Actions 16 0.32
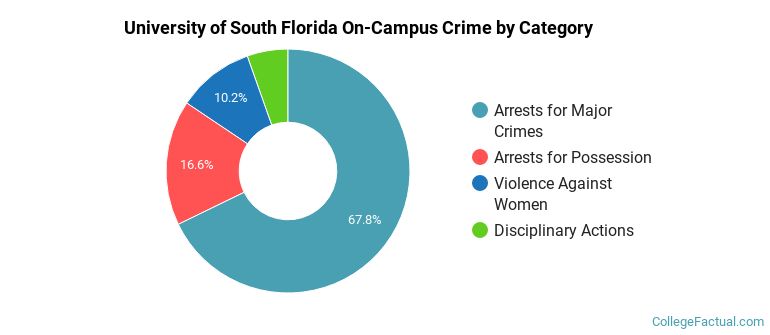
The percentage breakdown of USF Tampa on-campus crime and safety incidents by category is shown in the following chart.
In 2024, University of South Florida reported 8 incidents related to crime and safety that involved students on affiliated off-campus properties. Since the number of students at the school that year was 49,622, that’s 0.16 incidents per 1,000 students.
Below, you can see the number of incidents by category.Category Number of Incidents Number of Incidents per 1,000 students Arrests for Major Crimes 1 0.02 Arrests for Possession 2 0.04 Violence Against Women 4 0.08 Disciplinary Actions 1 0.02
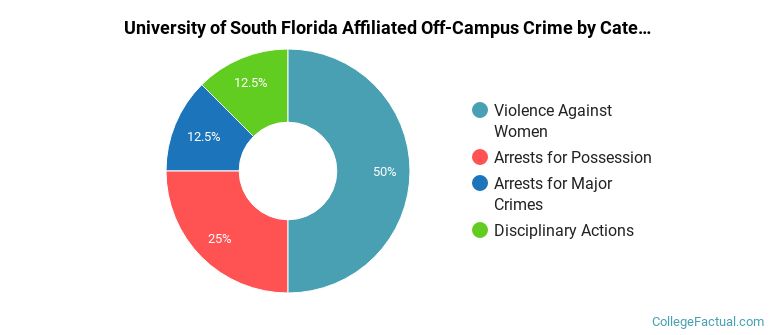
The chart below shows what percentage of USF Tampa crime and safety incidents on affiliated off-campus properties are in each category.
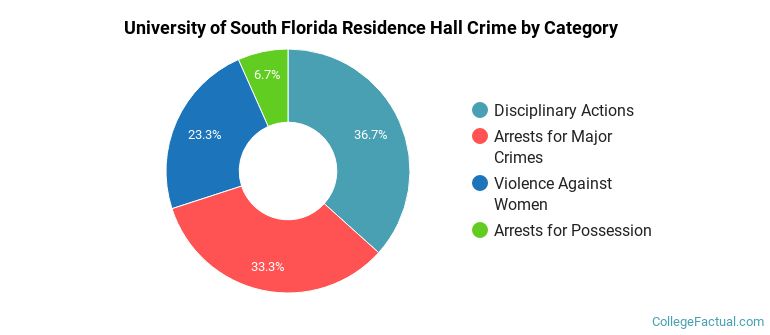
In 2024, University of South Florida reported 30 incidents related to crime and safety that involved students in residence halls. Note that these numbers are also included in the on-campus crimes category. That works out to 0.60 incidents per 1,000 students, considering that the student body population is 49,622.
Below, you can see the number of incidents by category.Category Number of Incidents Number of Incidents per 1,000 students Arrests for Major Crimes 10 0.20 Arrests for Possession 2 0.04 Violence Against Women 7 0.14 Disciplinary Actions 11 0.22
The chart below shows what percentage of USF Tampa crime and safety incidents in residence halls are in each category.
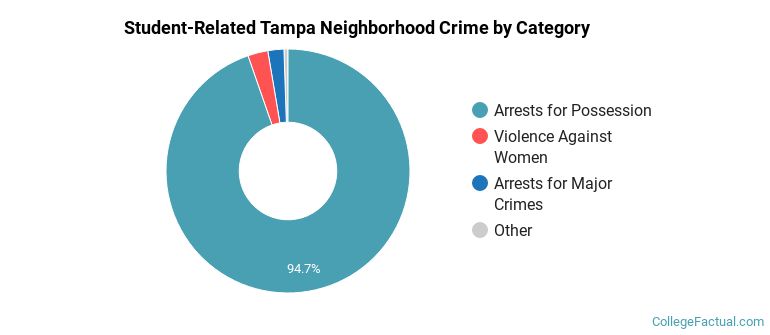
University of South Florida reported 188 incidents related to crime and safety in 2024. These student-involved incidents took place on Tampa public property in areas surrounding the campus. That works out to 3.79 incidents per 1,000 students, considering that the student body population is 49,622.
Below, you can see the number of incidents by category.Category Number of Incidents Number of Incidents per 1,000 students Arrests for Major Crimes 4 0.08 Arrests for Possession 178 3.59 Violence Against Women 5 0.10 Disciplinary Actions 1 0.02
The percentage breakdown of USF Tampa student-related crime and safety incidents by category in the surrounding Tampa neighborhood is shown in the following chart.
References
More about our data sources and methodologies.