We’ve pulled together the essential facts you should know about the program at University of St Francis. Degrees are awarded at the Bachelor’s level. Jump to any of the following sections:
The table below lists every degree level granted in entrepreneurial studies at University of St Francis, along with how many graduates complete each level annually.Degree Level Annual Graduates Bachelor’s 3
During the most recent reporting year, University of St Francis conferred 3 bachelor’s degrees in entrepreneurial studies.
University of St Francis is not yet ranked for entrepreneurial studies at the bachelor’s level.
Average full-time tuition and fees are listed in the table below.In State Out of State Tuition $35,000 $38,110
Find out more about University of St Francis tuition and fees.
Among recent graduates, 67% of entrepreneurial studies bachelor’s degrees went to men and 33% went to women.
 The largest share of entrepreneurial studies bachelor’s degree graduates at University of St Francis were Black or African American. About 33% of graduates fell into this category.
The following table and chart show the ethnic background for students who recently graduated from University of St Francis with a bachelor’s in entrepreneurial studies.
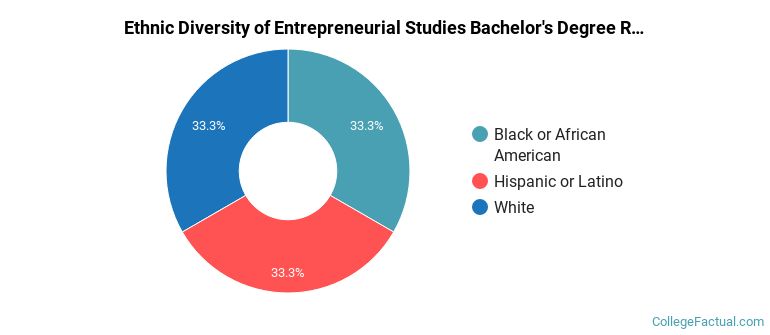
| Ethnic Background | Number of Students |
|---|---|
| Asian | 0 |
| Black or African American | 1 |
| Hispanic or Latino | 1 |
| White | 1 |
| Non-Resident Aliens | 0 |
| Other Races | 0 |
University of St Francis awarded 3 bachelor’s degrees in entrepreneurship/entrepreneurial studies recently — 33% to women and 67% to men. Most of these graduates identified as Black or African American (33%).