We’ve pulled together the essential facts you should know about the program at Virginia Tech. Degrees are awarded at the Bachelor’s level, with graduate study also available. Its best result is a rank of #2 out of 6 schools (Bachelor’s level) by College Factual. Jump to any of the following sections:
College Factual ranks Virginia Tech among the top schools in the country for civil engineering, coming in at #43 out of 254 schools nationally.Ranking Rank Best Civil Engineering Schools 43 of 254 Best Civil Engineering Schools in Virginia 2 of 6 Best Civil Engineering Schools in the Southeast Region 7 of 57
The table below lists every degree level granted in civil engineering at Virginia Tech, along with how many graduates complete each level annually.Degree Level Annual Graduates Bachelor’s 215 Master’s 106 Doctoral 19
For the most recent IPEDS reporting year, Virginia Polytechnic Institute and State University handed out 215 bachelor’s degrees in civil engineering.
Virginia Tech is among the very best schools in the country for civil engineering at the bachelor’s level. Specifically, it ranked #2 out of 6 schools by College Factual.
Civil Engineering graduates with a bachelor’s degree from Virginia Tech earn a median of $80,116 a year. This is higher than $77,896, the median for all majors at Virginia Tech.
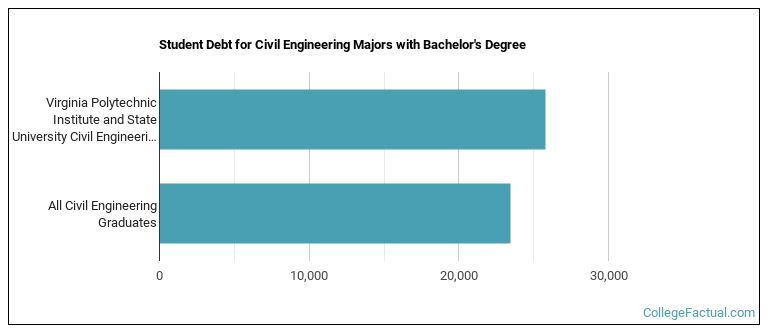
Earning a bachelor’s degree at Virginia Tech, civil engineering students accumulate a median of $25,760 in student loans. This is higher than $23,442, the typical median for all majors at Virginia Tech.
Information about average full-time undergraduate tuition and fees is shown in the table below.In State Out of State Tuition $11,420 $34,362 Fees $2,796 $3,402
Learn more about Virginia Tech tuition and fees.
For the most recent academic year available, 73% of civil engineering bachelor’s degrees went to men and 27% went to women.
 The largest share of civil engineering bachelor’s degree graduates at Virginia Tech are White. Approximately 68% of graduates fell into this category.
The following table and chart show the ethnic background for students who recently graduated from Virginia Polytechnic Institute and State University with a bachelor’s in civil engineering.
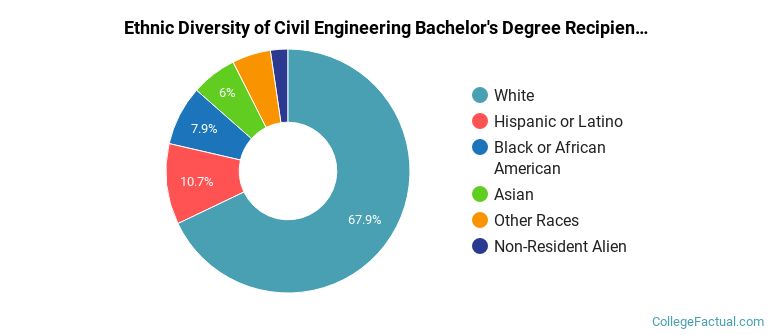
| Ethnic Background | Number of Students |
|---|---|
| Asian | 13 |
| Black or African American | 17 |
| Hispanic or Latino | 23 |
| White | 146 |
| Non-Resident Aliens | 5 |
| Other Races | 11 |
You can also pursue this field at the graduate level at Virginia Tech. Annual graduate completions by level are shown below.Graduate Level Annual Graduates Master’s Degrees in Civil Engineering 106 Doctoral Degrees in Civil Engineering 19
