Here is an overview of this program at Wartburg College. It is offered at the Bachelor’s level. Jump to any of the following sections:
The table below lists every degree level offered in romance languages at Wartburg College, along with how many graduates complete each level annually.Degree Level Annual Graduates Bachelor’s 5
For the most recent IPEDS reporting year, Wartburg College conferred 5 bachelor’s degrees in romance languages.
Wartburg College has not been ranked for romance languages at the bachelor’s level.
Information about average full-time undergraduate tuition and fees is shown in the table below.In State Out of State Tuition $45,200 $25,000 Fees $1,250 $1,250
Find out more about Wartburg College tuition and fees.
Every one of the 5 students who graduated with a bachelor’s degree in romance languages from Wartburg College were women.
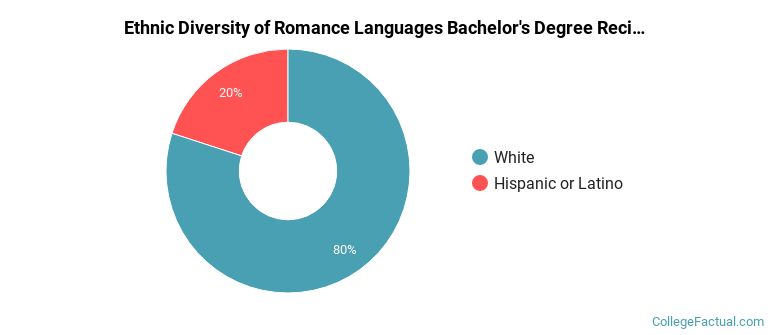
 The majority of romance languages bachelor’s degree graduates at Wartburg College were White. Approximately 80% of graduates fell into this category.
The following table and chart show the ethnic background for students who recently graduated from Wartburg College with a bachelor’s in romance languages.
| Ethnic Background | Number of Students |
|---|---|
| Asian | 0 |
| Black or African American | 0 |
| Hispanic or Latino | 1 |
| White | 4 |
| Non-Resident Aliens | 0 |
| Other Races | 0 |
Wartburg College granted 5 bachelor’s completions in spanish language and literature recently — 100% to women and 0% to men. The most common background among these graduates was White (80%).