Is WCU really diverse? College Factual’s diversity report brings to light the facts about diversity at WCU. We reviewed racial demographics, gender ratios, student age ranges, and where students come from.
What does diversity really mean at the college level? College Factual crunched the numbers to find out how diverse the average college campus really is, including race, gender, the ages of the students, and where they’re from.
WCU total enrollment is approximately 9,520 students. 8,663 are undergraduates and 857 are graduate students.
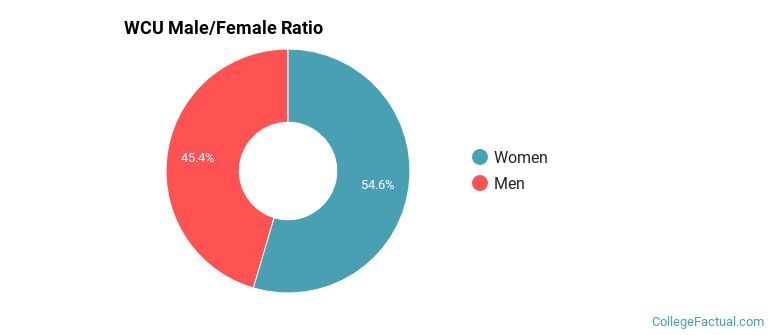
Male/Female Breakdown of Undergraduates
The full-time WCU undergraduate population is made up of 56.3% women, and 43.7% men.
For the gender breakdown for all students, go here.
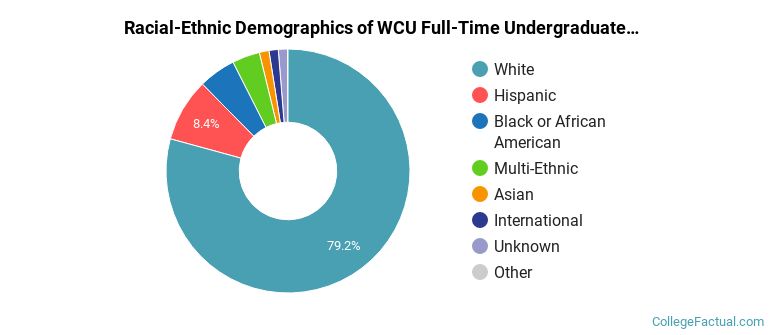
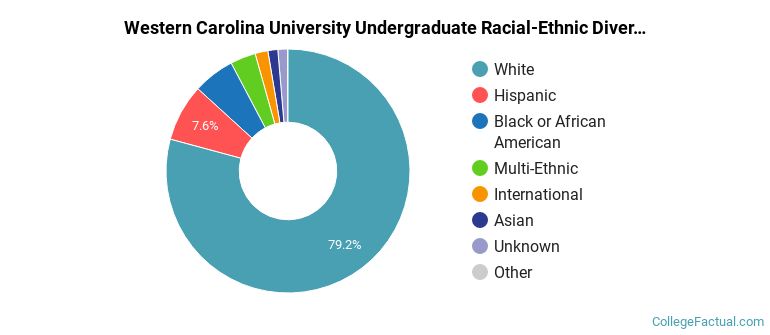
WCU Racial/Ethnic Breakdown of Undergraduates
| Race/Ethnicity | Number | Percent |
|---|---|---|
| White | 6,527 | 76.0% |
| Hispanic | 770 | 9.0% |
| Black or African American | 556 | 6.5% |
| Multi-Ethnic | 354 | 4.1% |
| International | 186 | 2.2% |
| Asian | 109 | 1.3% |
| Unknown | 78 | 0.9% |
| Native Hawaiian or Pacific Islander | 13 | 0.2% |
See racial/ethnic breakdown for all students.
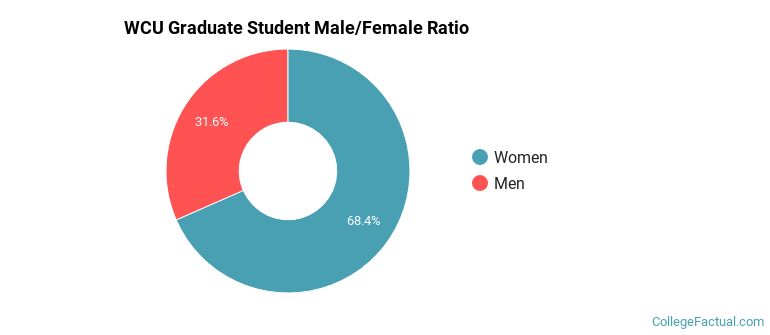
Male/Female Breakdown of Graduate Students
About 70.6% of full-time grad students are women, and 29.4% men.
For the gender breakdown for all students, go here.
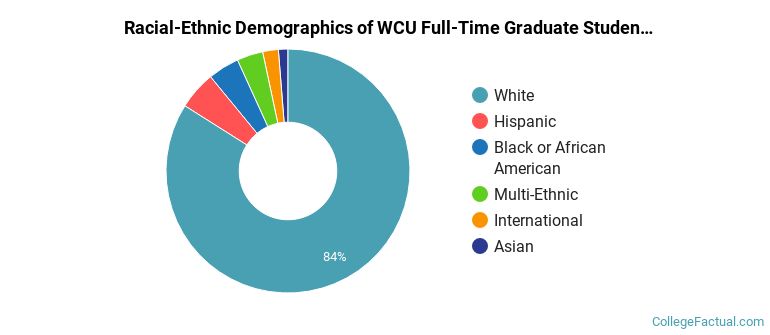
WCU Racial-Ethnic Breakdown of Graduate Students
| Race/Ethnicity | Number | Percent |
|---|---|---|
| White | 672 | 78.8% |
| Black or African American | 61 | 7.2% |
| Hispanic | 49 | 5.7% |
| Multi-Ethnic | 33 | 3.9% |
| International | 23 | 2.7% |
| Asian | 12 | 1.4% |
| Unknown | 3 | 0.4% |
See racial/ethnic breakdown for all students.
| Race/Ethnicity | Number | Percent |
|---|---|---|
| White | 7,199 | 76.2% |
| Hispanic | 819 | 8.7% |
| Black or African American | 617 | 6.5% |
| Multi-Ethnic | 387 | 4.1% |
| International | 209 | 2.2% |
| Asian | 121 | 1.3% |
| Unknown | 81 | 0.9% |
| Native Hawaiian or Pacific Islander | 13 | 0.1% |
Western Carolina University faculty racial/ethnic demographics (share of instructional staff):
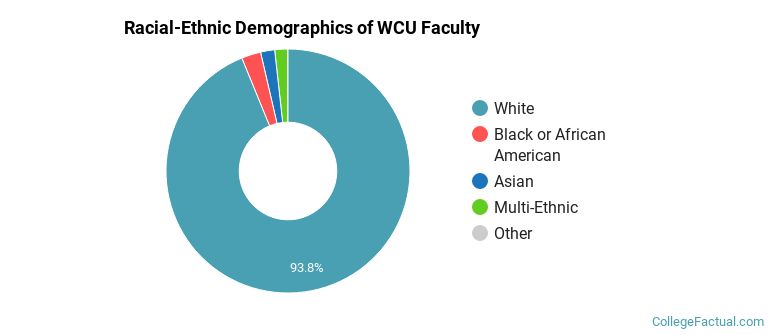
| Ethnicity | Percent of Faculty |
|---|---|
| White | 83.9% |
| Asian | 4.4% |
| International | 3.4% |
| Hispanic | 3.3% |
| Black or African American | 2.5% |
| Unknown | 1.3% |
| Multi-Ethnic | 0.9% |
This school is more popular with women than with men.
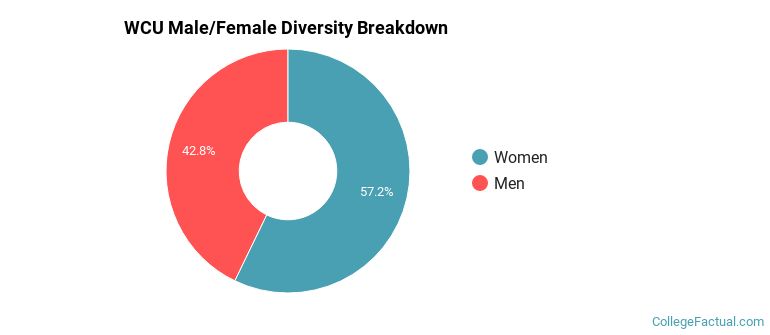
There are approximately 5,480 female students and 4,040 male students at WCU.
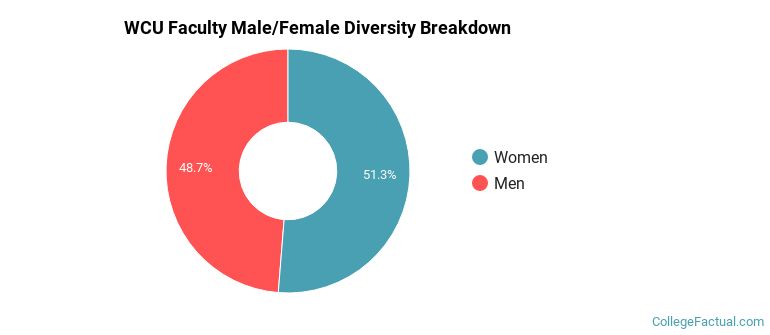
Western Carolina University faculty gender breakdown (share of instructional staff):
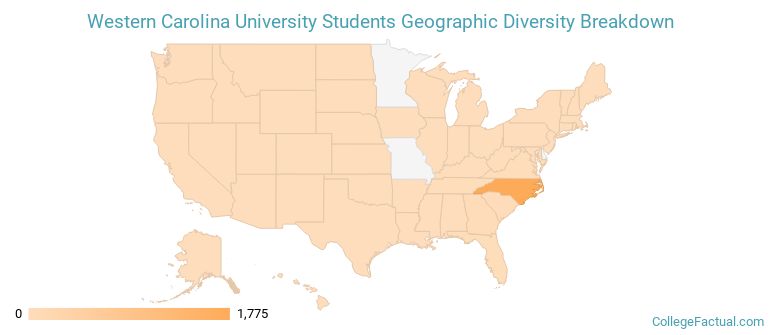
Among first-time degree-seeking undergraduates, 95.2% of WCU students come from within the state, and 4.8% come from out of state.
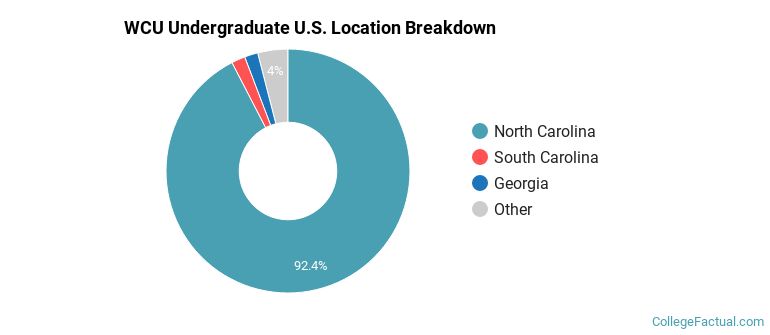
The undergraduate student body is split among 34 states (may include Washington D.C.). Click on the map for more detail.
| State | Amount | Percent |
|---|---|---|
| North Carolina | 1,548 | 77.4% |
| South Carolina | 167 | 8.3% |
| Georgia | 100 | 5.0% |
| Florida | 51 | 2.5% |
| Virginia | 20 | 1.0% |
WCU enrolls roughly 2.2% international (nonresident) students, adding to the global diversity of the campus.
A traditional college student is defined as being between the ages of 18-21. At WCU, 57.9% of undergraduate students fall into that category, compared to the national average of 60%.
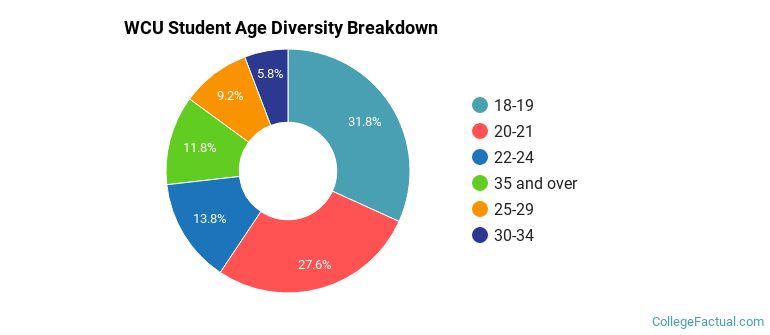
Student Age Group Amount Percent 18-19 3,712 31.8% 20-21 3,054 26.1% 22-24 1,692 14.5% 35 and over 1,496 12.8% 25-29 951 8.1% 30-34 684 5.9% Under 18 97 0.8%
Footnotes
*The racial-ethnic minorities count is calculated by taking the total number of students and subtracting white students, international students, and students whose race/ethnicity was unknown. This number is then divided by the total number of students at the school to obtain the racial-ethnic minorities percentage.
References